P
Seller's Agent in 2024
P. Michelle Johnson
Coldwell Banker Select Real Estate
(530) 736-2236
9 Total Sales
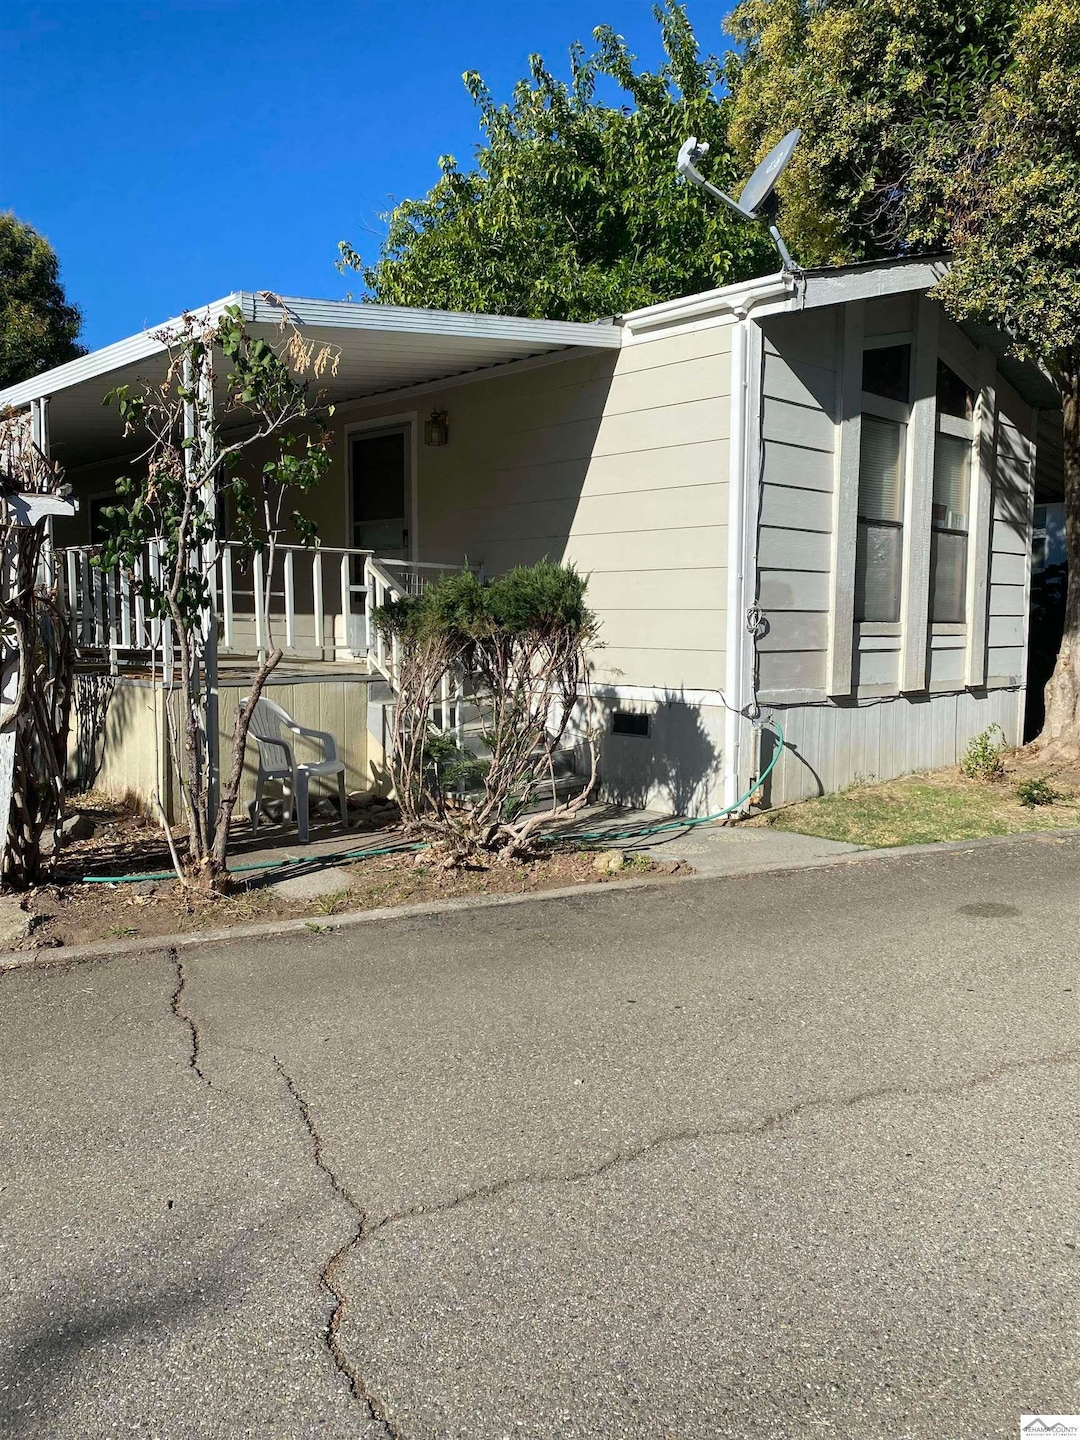

2/1 with large porch and covered parking. Make this little gem yours. All age park on the Sacramento River. There is a yard and plenty of storage.
Last Agent to Sell the Property
Coldwell Banker Select Real Estate License #02082516 Listed on: 10/21/2023

Last Buyer's Agent
OUT OF AREA NON MEMBER
Out Of Area Office
| Date | Event | Price | List to Sale | Price per Sq Ft | Prior Sale |
|---|---|---|---|---|---|
| 01/22/2024 01/22/24 | Sold | $27,900 | 0.0% | $33 / Sq Ft | |
| 12/03/2023 12/03/23 | Price Changed | $27,900 | -6.7% | $33 / Sq Ft | |
| 11/06/2023 11/06/23 | Price Changed | $29,900 | -11.8% | $36 / Sq Ft | |
| 10/21/2023 10/21/23 | For Sale | $33,900 | -3.1% | $40 / Sq Ft | |
| 03/27/2023 03/27/23 | Sold | $35,000 | 0.0% | $48 / Sq Ft | View Prior Sale |
| 03/09/2023 03/09/23 | For Sale | $35,000 | +180.0% | $48 / Sq Ft | |
| 11/30/2022 11/30/22 | Sold | $12,500 | 0.0% | $14 / Sq Ft | View Prior Sale |
| 11/21/2022 11/21/22 | Pending | -- | -- | -- | |
| 11/15/2022 11/15/22 | Price Changed | $12,500 | -16.7% | $14 / Sq Ft | |
| 10/22/2022 10/22/22 | Price Changed | $15,000 | -25.0% | $17 / Sq Ft | |
| 09/20/2022 09/20/22 | For Sale | $20,000 | -74.0% | $22 / Sq Ft | |
| 03/11/2022 03/11/22 | Sold | $77,000 | -10.5% | $73 / Sq Ft | View Prior Sale |
| 02/11/2022 02/11/22 | For Sale | $86,000 | +75.5% | $81 / Sq Ft | |
| 10/18/2021 10/18/21 | Sold | $49,000 | 0.0% | $67 / Sq Ft | View Prior Sale |
| 10/07/2021 10/07/21 | Pending | -- | -- | -- | |
| 09/10/2021 09/10/21 | For Sale | $49,000 | +40.0% | $67 / Sq Ft | |
| 06/18/2021 06/18/21 | Sold | $35,000 | 0.0% | $39 / Sq Ft | View Prior Sale |
| 06/01/2021 06/01/21 | Pending | -- | -- | -- | |
| 05/17/2021 05/17/21 | For Sale | $35,000 | -- | $39 / Sq Ft |
| Year | Tax Paid | Tax Assessment Tax Assessment Total Assessment is a certain percentage of the fair market value that is determined by local assessors to be the total taxable value of land and additions on the property. | Land | Improvement |
|---|---|---|---|---|
| 2025 | $17,170 | $1,649,523 | $771,844 | $877,679 |
| 2023 | $16,932 | $1,586,529 | $741,873 | $844,656 |
| 2022 | $16,450 | $1,556,325 | $727,327 | $828,998 |
| 2021 | $16,151 | $1,525,572 | $713,066 | $812,506 |
| 2020 | $16,082 | $1,504,825 | $705,755 | $799,070 |
| 2019 | $17,730 | $1,637,021 | $1,258,624 | $378,397 |
| 2018 | $16,915 | $1,605,088 | $1,233,946 | $371,142 |
| 2017 | $17,051 | $1,573,542 | $1,209,751 | $363,791 |
| 2016 | $15,932 | $1,542,393 | $1,186,031 | $356,362 |
| 2015 | $15,678 | $1,519,248 | $1,168,216 | $351,032 |
| 2014 | $15,441 | $1,488,594 | $1,145,333 | $343,261 |
P
Seller's Agent in 2024
P. Michelle Johnson
Coldwell Banker Select Real Estate
(530) 736-2236
9 Total Sales
O
Buyer's Agent in 2024
OUT OF AREA NON MEMBER
Out Of Area Office
T
Buyer's Agent in 2023
Timothy Burr
Gold Mine Realty Pine Grove
S
Seller's Agent in 2022
Sarah Neel
Coldwell Banker C & C Properties - Red Bluff
Seller's Agent in 2022
Becky Johns
eXp Realty of Northern California
(530) 519-5553
219 Total Sales
Seller's Agent in 2021
Savannah Carlson
RE/MAX
(530) 527-1111
64 Total Sales
Source: Tehama County Association of REALTORS®
MLS Number: 20230843
APN: 009-210-023-000
Disclaimer: Certain information contained herein is derived from information provided by parties other than Homes.com. All information provided is deemed reliable, but is not guaranteed to be accurate and should be independently verified.
![]() IDX information is provided exclusively for personal, non-commercial use, and may not be used for any purpose other than to identify prospective properties consumers may be interested in purchasing. Information is deemed reliable but not guaranteed.
IDX information is provided exclusively for personal, non-commercial use, and may not be used for any purpose other than to identify prospective properties consumers may be interested in purchasing. Information is deemed reliable but not guaranteed.
Ask me questions while you tour the home.