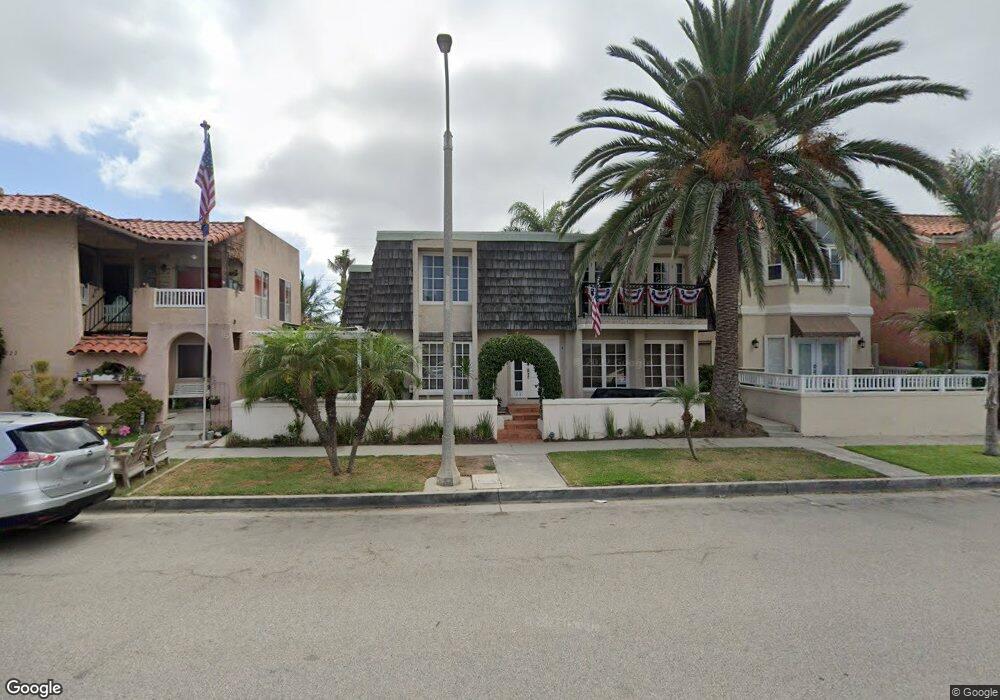
218 16th St Unit C Huntington Beach, CA 92648
Downtown Huntington Beach NeighborhoodEstimated Value: $833,187 - $1,062,000
2
Beds
2
Baths
1,004
Sq Ft
$930/Sq Ft
Est. Value
About This Home
This home is located at 218 16th St Unit C, Huntington Beach, CA 92648 and is currently estimated at $934,047, approximately $930 per square foot. 218 16th St Unit C is a home located in Orange County with nearby schools including Agnes L. Smith Elementary, Ethel Dwyer Middle, and Huntington Beach High School.
Ownership History
Date
Name
Owned For
Owner Type
Purchase Details
Closed on
Sep 26, 2014
Sold by
Holmes Robert B
Bought by
Holmes Kayla
Current Estimated Value
Purchase Details
Closed on
May 14, 2003
Sold by
Holmes Kayla and Morejon Kayla
Bought by
Holmes Robert B and Holmes Kayla
Home Financials for this Owner
Home Financials are based on the most recent Mortgage that was taken out on this home.
Original Mortgage
$237,300
Interest Rate
5.75%
Mortgage Type
Stand Alone First
Purchase Details
Closed on
Jan 2, 2002
Sold by
Watson Leroy D and Watson Lisa Marie
Bought by
Morejon Kayla
Home Financials for this Owner
Home Financials are based on the most recent Mortgage that was taken out on this home.
Original Mortgage
$237,500
Interest Rate
7.15%
Purchase Details
Closed on
Mar 28, 2001
Sold by
Watson Lisa Marie
Bought by
Watson Leroy D and Watson Lisa Marie
Create a Home Valuation Report for This Property
The Home Valuation Report is an in-depth analysis detailing your home's value as well as a comparison with similar homes in the area
Home Values in the Area
Average Home Value in this Area
Purchase History
| Date | Buyer | Sale Price | Title Company |
|---|---|---|---|
| Holmes Kayla | -- | None Available | |
| Holmes Robert B | -- | -- | |
| Morejon Kayla | $250,000 | Stewart Title | |
| Watson Leroy D | -- | -- |
Source: Public Records
Mortgage History
| Date | Status | Borrower | Loan Amount |
|---|---|---|---|
| Closed | Holmes Robert B | $237,300 | |
| Closed | Morejon Kayla | $237,500 |
Source: Public Records
Tax History Compared to Growth
Tax History
| Year | Tax Paid | Tax Assessment Tax Assessment Total Assessment is a certain percentage of the fair market value that is determined by local assessors to be the total taxable value of land and additions on the property. | Land | Improvement |
|---|---|---|---|---|
| 2025 | $4,379 | $369,315 | $276,713 | $92,602 |
| 2024 | $4,379 | $362,074 | $271,287 | $90,787 |
| 2023 | $4,279 | $354,975 | $265,968 | $89,007 |
| 2022 | $4,166 | $348,015 | $260,753 | $87,262 |
| 2021 | $4,091 | $341,192 | $255,641 | $85,551 |
| 2020 | $4,063 | $337,694 | $253,020 | $84,674 |
| 2019 | $4,017 | $331,073 | $248,059 | $83,014 |
| 2018 | $3,956 | $324,582 | $243,195 | $81,387 |
| 2017 | $3,904 | $318,218 | $238,426 | $79,792 |
| 2016 | $3,737 | $311,979 | $233,751 | $78,228 |
| 2015 | $3,700 | $307,293 | $230,240 | $77,053 |
| 2014 | $3,623 | $301,274 | $225,730 | $75,544 |
Source: Public Records
Map
Nearby Homes
- 306 17th St
- 125 16th St
- 1516 Pacific Coast Hwy Unit 101
- 1400 Pacific Coast Hwy Unit 305
- 319 14th St Unit B
- 304 18th St
- 416 15th St
- 413 14th St Unit D
- 1200 Pacific Coast Hwy Unit 102
- 1200 Pacific Coast Hwy
- 1200 Pacific Coast Hwy Unit 214
- 419 18th St
- 505 17th St
- 228 12th St Unit 1113 Olive Av
- 1111 Olive Ave Unit A & B
- 323 11th St
- 412 20th St
- 521 18th St
- 1102 Pacific Coast Hwy Unit Lot 4
- 2000 Pacific Coast Hwy Unit 313
- 218 16th St
- 218 16th St Unit D
- 218 16th St Unit B
- 218 16th St Unit A
- 216 16th St
- 214 16th St
- 210 16th St
- 219 15th St Unit 12
- 219 15th St Unit 5
- 219 15th St
- 219 15th St Unit 4
- 219 15th St Unit 3
- 219 15th St Unit 7
- 219 15th St Unit 10
- 219 15th St Unit 8
- 208 16th St
- 213 15th St
- 206 16th St
- 205 15th St
- 213 16th St