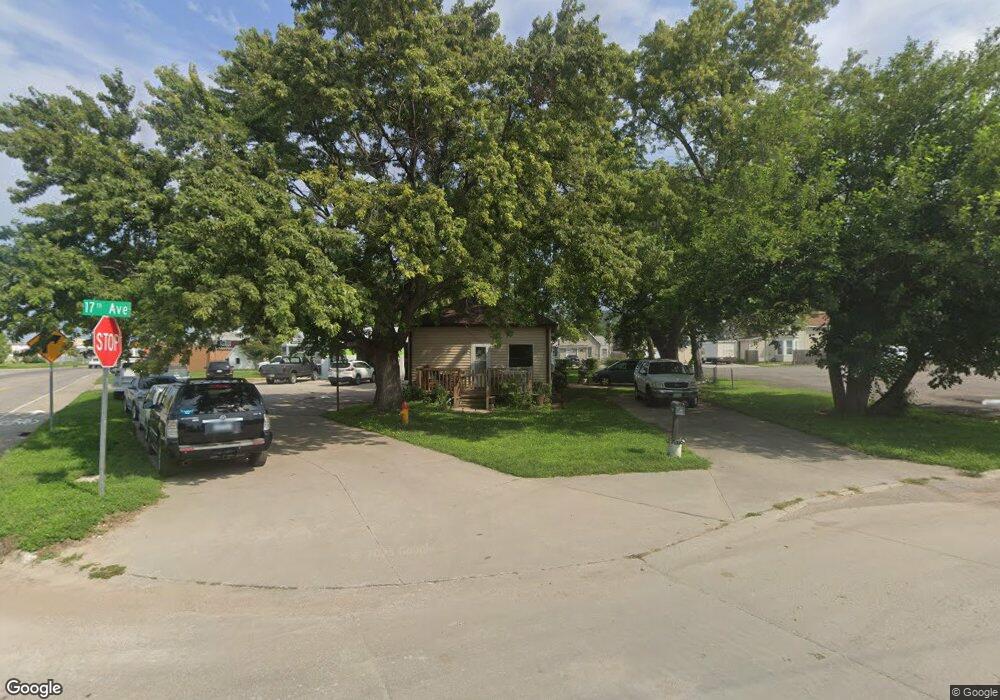
218 17th Ave Council Bluffs, IA 51503
Eastern Council Bluffs NeighborhoodEstimated Value: $196,000 - $250,000
2
Beds
1
Bath
994
Sq Ft
$220/Sq Ft
Est. Value
About This Home
This home is located at 218 17th Ave, Council Bluffs, IA 51503 and is currently estimated at $218,737, approximately $220 per square foot. 218 17th Ave is a home located in Pottawattamie County with nearby schools including Longfellow Elementary School, Gerald W. Kirn Middle School, and Abraham Lincoln High School.
Ownership History
Date
Name
Owned For
Owner Type
Purchase Details
Closed on
Dec 13, 2024
Sold by
Juon Brandon
Bought by
Lustgraaf Thomas E
Current Estimated Value
Purchase Details
Closed on
Sep 23, 2021
Sold by
Lustgraaf Thomas E
Bought by
Western Iowa Investments Llc
Home Financials for this Owner
Home Financials are based on the most recent Mortgage that was taken out on this home.
Original Mortgage
$59,235
Interest Rate
5%
Mortgage Type
Land Contract Argmt. Of Sale
Create a Home Valuation Report for This Property
The Home Valuation Report is an in-depth analysis detailing your home's value as well as a comparison with similar homes in the area
Home Values in the Area
Average Home Value in this Area
Purchase History
| Date | Buyer | Sale Price | Title Company |
|---|---|---|---|
| Lustgraaf Thomas E | $213,000 | None Listed On Document | |
| Lustgraaf Thomas E | $213,000 | None Listed On Document | |
| Western Iowa Investments Llc | $59,235 | None Available |
Source: Public Records
Mortgage History
| Date | Status | Borrower | Loan Amount |
|---|---|---|---|
| Previous Owner | Western Iowa Investments Llc | $59,235 |
Source: Public Records
Tax History Compared to Growth
Tax History
| Year | Tax Paid | Tax Assessment Tax Assessment Total Assessment is a certain percentage of the fair market value that is determined by local assessors to be the total taxable value of land and additions on the property. | Land | Improvement |
|---|---|---|---|---|
| 2025 | $2,166 | $96,100 | $27,300 | $68,800 |
| 2024 | $2,166 | $89,700 | $23,800 | $65,900 |
| 2023 | $2,414 | $89,700 | $23,800 | $65,900 |
| 2022 | $2,322 | $84,400 | $19,300 | $65,100 |
| 2021 | $3,034 | $84,400 | $19,300 | $65,100 |
| 2020 | $2,162 | $84,400 | $19,300 | $65,100 |
| 2019 | $2,226 | $74,000 | $14,623 | $59,377 |
| 2018 | $2,116 | $74,000 | $14,623 | $59,377 |
| 2017 | $2,052 | $74,000 | $14,623 | $59,377 |
| 2015 | $2,096 | $74,000 | $14,623 | $59,377 |
| 2014 | $2,192 | $74,000 | $14,623 | $59,377 |
Source: Public Records
Map
Nearby Homes