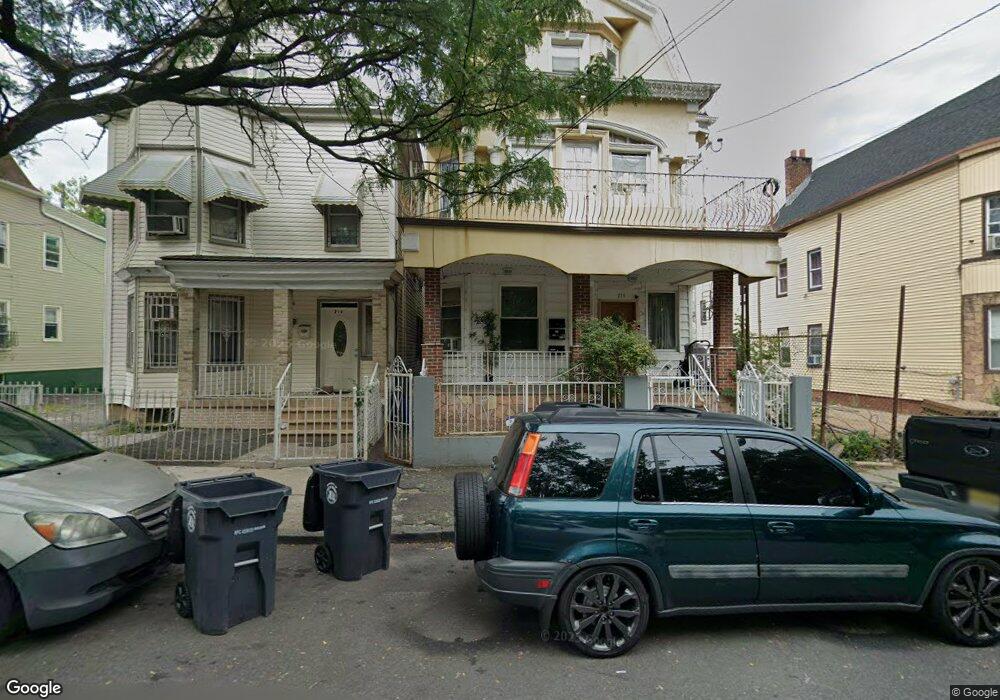
218 3rd St Unit 3 Newark, NJ 07107
Lower Roseville NeighborhoodEstimated Value: $615,564 - $705,000
2
Beds
1
Bath
2,891
Sq Ft
$229/Sq Ft
Est. Value
About This Home
This home is located at 218 3rd St Unit 3, Newark, NJ 07107 and is currently estimated at $662,391, approximately $229 per square foot. 218 3rd St Unit 3 is a home located in Essex County with nearby schools including Dr. William H. Horton School, Franklin School, and First Avenue Elementary School.
Ownership History
Date
Name
Owned For
Owner Type
Purchase Details
Closed on
Dec 30, 2022
Sold by
Thompson Jordan
Bought by
Maddan Ovril
Current Estimated Value
Home Financials for this Owner
Home Financials are based on the most recent Mortgage that was taken out on this home.
Original Mortgage
$470,593
Outstanding Balance
$455,986
Interest Rate
6.58%
Mortgage Type
FHA
Estimated Equity
$206,405
Purchase Details
Closed on
Jun 22, 2020
Sold by
Traverzo Shirley
Bought by
Thompson Jordan
Home Financials for this Owner
Home Financials are based on the most recent Mortgage that was taken out on this home.
Original Mortgage
$412,392
Interest Rate
3.1%
Mortgage Type
FHA
Purchase Details
Closed on
Feb 13, 2002
Sold by
Rivera Alcides
Bought by
Traverzo Shirley
Create a Home Valuation Report for This Property
The Home Valuation Report is an in-depth analysis detailing your home's value as well as a comparison with similar homes in the area
Home Values in the Area
Average Home Value in this Area
Purchase History
| Date | Buyer | Sale Price | Title Company |
|---|---|---|---|
| Maddan Ovril | $515,000 | Stewart Title Guaranty Company | |
| Thompson Jordan | $420,000 | Main Street Title | |
| Traverzo Shirley | -- | -- |
Source: Public Records
Mortgage History
| Date | Status | Borrower | Loan Amount |
|---|---|---|---|
| Open | Maddan Ovril | $470,593 | |
| Previous Owner | Thompson Jordan | $412,392 |
Source: Public Records
Tax History
| Year | Tax Paid | Tax Assessment Tax Assessment Total Assessment is a certain percentage of the fair market value that is determined by local assessors to be the total taxable value of land and additions on the property. | Land | Improvement |
|---|---|---|---|---|
| 2025 | $12,717 | $334,400 | $18,800 | $315,600 |
| 2024 | $12,466 | $334,400 | $18,800 | $315,600 |
| 2022 | $12,493 | $334,400 | $18,800 | $315,600 |
| 2021 | $12,487 | $334,400 | $18,800 | $315,600 |
| 2020 | $5,962 | $156,900 | $18,800 | $138,100 |
| 2019 | $5,901 | $156,900 | $18,800 | $138,100 |
| 2018 | $5,794 | $156,900 | $18,800 | $138,100 |
| 2017 | $5,586 | $156,900 | $18,800 | $138,100 |
| 2016 | $5,397 | $156,900 | $18,800 | $138,100 |
| 2015 | $5,192 | $156,900 | $18,800 | $138,100 |
| 2014 | $4,865 | $156,900 | $18,800 | $138,100 |
Source: Public Records
Map
Nearby Homes
- 245 - 247 4th St Unit 2
- 212 3rd St
- 238 6th Ave W
- 237-239 6th Ave W
- 314 7th Ave W
- 213 N 7th St
- 203 2nd St
- 267 6th Ave W
- 285 N 6th St
- 449 Orange St
- 496 Orange St
- 160-162 Roseville Ave
- 109 N 7th St
- 109 S 7th St Unit 111
- 437 7th Ave W Unit 439
- 437-439 W 7th Ave Unit 4
- 96 N 5th St
- 323 N 7th St
- 238 Roseville Ave
- 343 Sussex Ave Unit 2
Your Personal Tour Guide
Ask me questions while you tour the home.