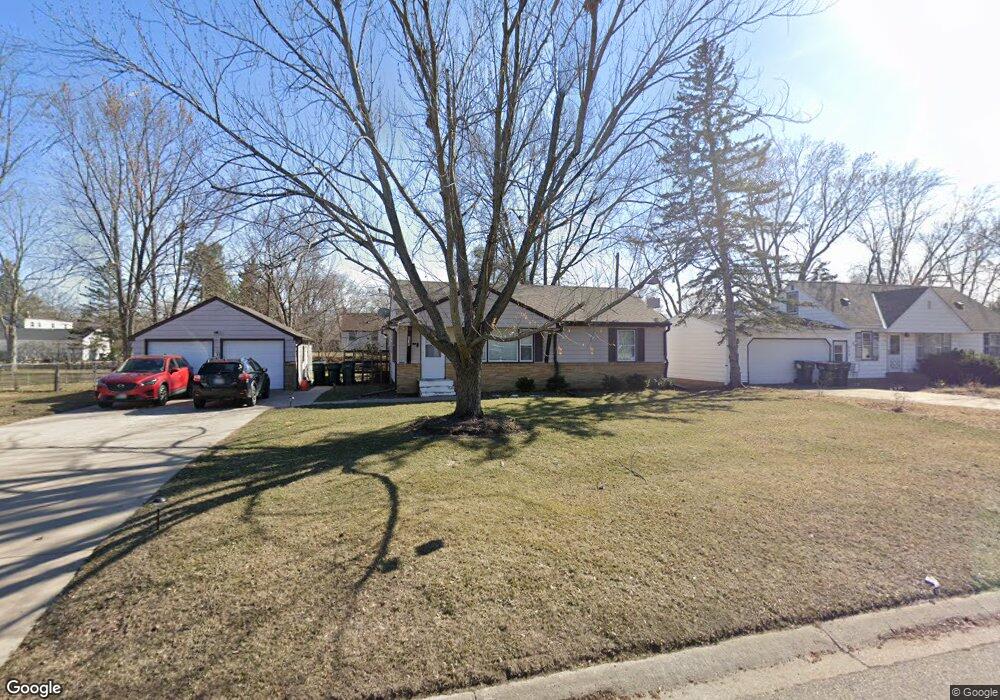
218 91st Ave NE Minneapolis, MN 55434
Estimated Value: $306,000 - $328,000
4
Beds
2
Baths
1,629
Sq Ft
$196/Sq Ft
Est. Value
About This Home
This home is located at 218 91st Ave NE, Minneapolis, MN 55434 and is currently estimated at $318,568, approximately $195 per square foot. 218 91st Ave NE is a home located in Anoka County with nearby schools including University Elementary School, Northdale Middle School, and Blaine Senior High School.
Ownership History
Date
Name
Owned For
Owner Type
Purchase Details
Closed on
Jun 30, 2021
Sold by
Bayati Ahmed Al and Abdullah Raja
Bought by
Lee Lavy and Arignamath Tasha
Current Estimated Value
Home Financials for this Owner
Home Financials are based on the most recent Mortgage that was taken out on this home.
Original Mortgage
$264,030
Outstanding Balance
$239,566
Interest Rate
2.9%
Mortgage Type
New Conventional
Estimated Equity
$79,002
Purchase Details
Closed on
Oct 24, 2016
Sold by
Secretary Of Hud
Bought by
Bayati Ahmed Al and Abdullah Rajaa
Home Financials for this Owner
Home Financials are based on the most recent Mortgage that was taken out on this home.
Original Mortgage
$91,000
Interest Rate
3.48%
Mortgage Type
New Conventional
Purchase Details
Closed on
Aug 15, 1997
Sold by
Elliott Edwin E and Elliott Margery A
Bought by
Courneya April and Courneya Morgan B
Create a Home Valuation Report for This Property
The Home Valuation Report is an in-depth analysis detailing your home's value as well as a comparison with similar homes in the area
Home Values in the Area
Average Home Value in this Area
Purchase History
| Date | Buyer | Sale Price | Title Company |
|---|---|---|---|
| Lee Lavy | $272,196 | Modern Title Llc | |
| Bayati Ahmed Al | -- | Title One Inc | |
| Courneya April | $85,000 | -- |
Source: Public Records
Mortgage History
| Date | Status | Borrower | Loan Amount |
|---|---|---|---|
| Open | Lee Lavy | $264,030 | |
| Previous Owner | Bayati Ahmed Al | $91,000 |
Source: Public Records
Tax History Compared to Growth
Tax History
| Year | Tax Paid | Tax Assessment Tax Assessment Total Assessment is a certain percentage of the fair market value that is determined by local assessors to be the total taxable value of land and additions on the property. | Land | Improvement |
|---|---|---|---|---|
| 2025 | $2,794 | $281,000 | $110,000 | $171,000 |
| 2024 | $2,794 | $277,100 | $108,200 | $168,900 |
| 2023 | $2,574 | $270,500 | $100,000 | $170,500 |
| 2022 | $2,280 | $267,300 | $86,400 | $180,900 |
| 2021 | $2,217 | $221,600 | $75,000 | $146,600 |
| 2020 | $2,165 | $211,600 | $73,000 | $138,600 |
| 2019 | $1,998 | $200,200 | $68,300 | $131,900 |
| 2018 | $1,875 | $182,800 | $0 | $0 |
| 2017 | $1,626 | $169,400 | $0 | $0 |
| 2016 | $1,803 | $151,100 | $0 | $0 |
| 2015 | -- | $151,100 | $55,500 | $95,600 |
| 2014 | -- | $129,100 | $45,000 | $84,100 |
Source: Public Records
Map
Nearby Homes
- 191 91st Ln NE
- 161 91st Ave NE
- 211 92nd Ave NE
- 663 91st Ave NE
- 403 Pleasure Creek Dr
- 379 95th Ln NE
- 8730 Jackson St NE
- 8722 Jackson St NE
- 9145 Tyler St NE
- 917 94th Ave NE
- 111 96th Ln NE
- 8709 Able St NE
- 583 97th Ln NE
- XXX Holly St NW
- 877 96th Ave NE
- 9872 7th St NE
- 484 98th Ln NE
- 9896 Clover Leaf Pkwy NE
- 8380 6th St NE
- 881 Manor Dr NE
- 210 91st Ave NE
- 226 91st Ave NE
- 200 91st Ave NE
- 211 91st Ave NE
- 234 91st Ave NE
- 221 91st Ave NE
- 241 90th Ln NE
- 201 90th Ln NE
- 201 91st Ave NE
- 9056 7th St NE
- 190 91st Ave NE
- 193 91st Ave NE
- 9070 7th St NE
- 191 90th Ln NE
- 251 91st Ave NE
- 180 91st Ave NE
- 210 91st Ln NE
- 210 210 91st-Lane-ne
- 185 91st Ave NE
- 9099 7th St NE