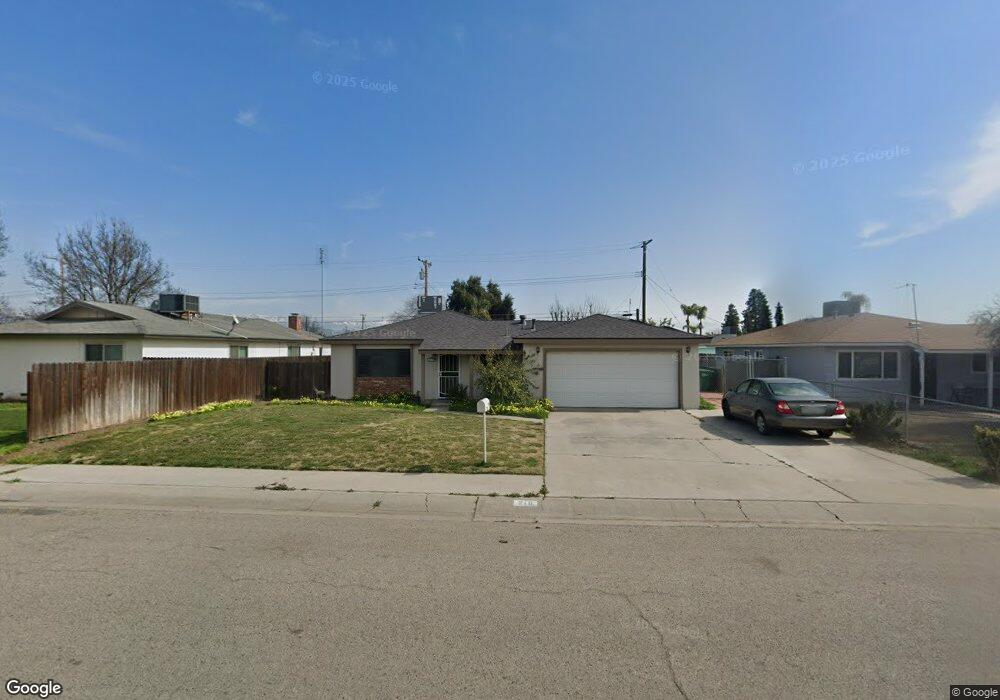
218 Argyle St Porterville, CA 93257
Porterville Northwest NeighborhoodEstimated Value: $244,000 - $296,000
3
Beds
2
Baths
1,148
Sq Ft
$239/Sq Ft
Est. Value
About This Home
This home is located at 218 Argyle St, Porterville, CA 93257 and is currently estimated at $274,832, approximately $239 per square foot. 218 Argyle St is a home located in Tulare County with nearby schools including Burton Elementary School, Burton Middle School, and Porterville High School.
Ownership History
Date
Name
Owned For
Owner Type
Purchase Details
Closed on
Nov 14, 2000
Sold by
Hud
Bought by
Serrato Ramiro N and Serrato Socorro A
Current Estimated Value
Home Financials for this Owner
Home Financials are based on the most recent Mortgage that was taken out on this home.
Original Mortgage
$61,750
Outstanding Balance
$22,656
Interest Rate
7.82%
Estimated Equity
$252,176
Purchase Details
Closed on
Aug 11, 2000
Sold by
Midfirst Bank
Bought by
Hud
Purchase Details
Closed on
Jun 30, 2000
Sold by
Wren R E
Bought by
Midfirst Bank and Midfirst Bank State Svgs Bank
Purchase Details
Closed on
Oct 18, 1996
Sold by
Wren R E
Bought by
Wren Ii R E and Wren Yvette
Home Financials for this Owner
Home Financials are based on the most recent Mortgage that was taken out on this home.
Original Mortgage
$17,157
Interest Rate
8.3%
Create a Home Valuation Report for This Property
The Home Valuation Report is an in-depth analysis detailing your home's value as well as a comparison with similar homes in the area
Home Values in the Area
Average Home Value in this Area
Purchase History
| Date | Buyer | Sale Price | Title Company |
|---|---|---|---|
| Serrato Ramiro N | $65,000 | Cuesta Title | |
| Hud | -- | United Title Company | |
| Midfirst Bank | $61,176 | United Title Company | |
| Wren Ii R E | -- | -- |
Source: Public Records
Mortgage History
| Date | Status | Borrower | Loan Amount |
|---|---|---|---|
| Open | Serrato Ramiro N | $61,750 | |
| Previous Owner | Wren Ii R E | $17,157 |
Source: Public Records
Tax History
| Year | Tax Paid | Tax Assessment Tax Assessment Total Assessment is a certain percentage of the fair market value that is determined by local assessors to be the total taxable value of land and additions on the property. | Land | Improvement |
|---|---|---|---|---|
| 2025 | $1,182 | $97,946 | $37,670 | $60,276 |
| 2024 | $1,182 | $96,027 | $36,932 | $59,095 |
| 2023 | $1,185 | $94,145 | $36,208 | $57,937 |
| 2022 | $1,127 | $92,300 | $35,499 | $56,801 |
| 2021 | $1,130 | $90,490 | $34,803 | $55,687 |
| 2020 | $1,112 | $89,562 | $34,446 | $55,116 |
| 2019 | $1,111 | $87,806 | $33,771 | $54,035 |
| 2018 | $1,069 | $86,084 | $33,109 | $52,975 |
| 2017 | $1,054 | $84,396 | $32,460 | $51,936 |
| 2016 | $1,012 | $82,742 | $31,824 | $50,918 |
| 2015 | $828 | $81,499 | $31,346 | $50,153 |
| 2014 | $828 | $79,903 | $30,732 | $49,171 |
Source: Public Records
Map
Nearby Homes
- 334 N Argyle St
- 339 N Lombardi St
- 100 S Westwood St Unit 15
- 100 S Westwood St Unit 92
- 100 S Westwood St Unit 13
- 100 S Westwood St Unit Lot 105
- 100 S Westwood St Unit 110
- 100 S Westwood St Unit 78
- 100 S Westwood St Unit 103
- 2300 W Morton Ave Unit 160
- 2300 W Morton Ave Unit 22
- 434 N Jennifer Way
- 480 N Belmont St
- 215 S Red Oak St
- 790 Rose Ln
- 572 N Verdugo Dr
- 1676 W Putnam Ave
- 610 Wellington St
- 415 Colby Place
- 1942 W Date Ave
- 2121 W Cleveland Ave
- 210 Argyle St
- 200 Argyle St
- 200 N Argyle St
- 219 N Balmayne St
- 2155 W Cleveland Ave
- 207 Argyle St
- 207 N Argyle St
- 2101 W Cleveland Ave
- 211 N Balmayne St
- 2122 W Cleveland Ave
- 201 Argyle St
- 201 N Balmayne St
- 190 Argyle St
- 2156 W Cleveland Ave
- 191 Argyle St
- 2100 W Cleveland Ave
- 191 N Balmayne St
- 264 N Argyle St
- 191 N Argyle St
Your Personal Tour Guide
Ask me questions while you tour the home.