Estimated Value: $296,000 - $312,000
--
Bed
3
Baths
1,588
Sq Ft
$190/Sq Ft
Est. Value
About This Home
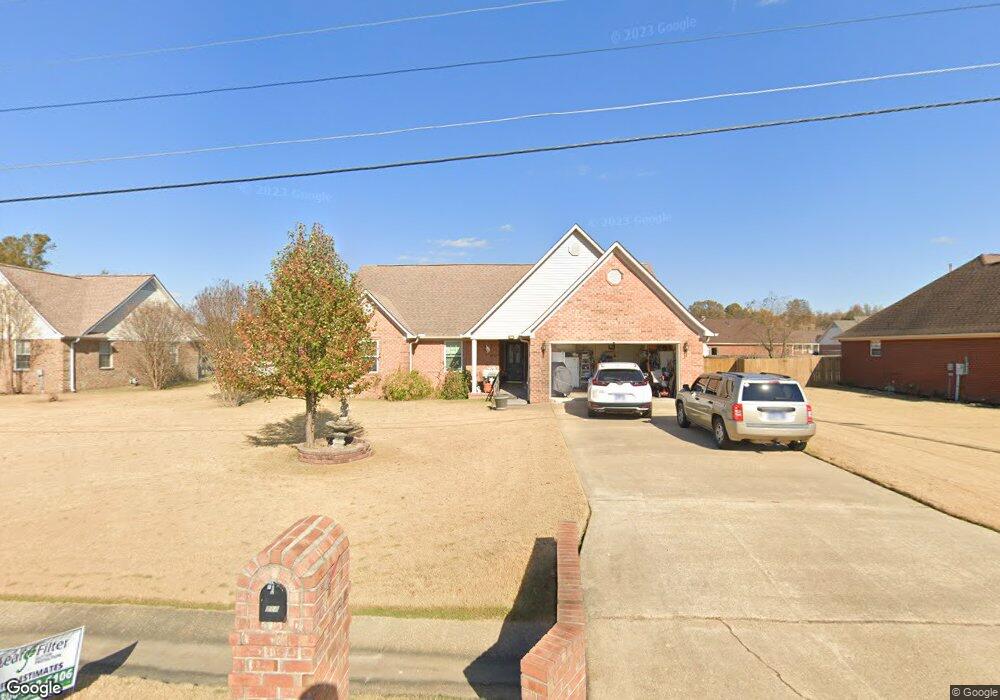
This home is located at 218 Azalea Dr, Atoka, TN 38004 and is currently estimated at $301,923, approximately $190 per square foot. 218 Azalea Dr is a home located in Tipton County with nearby schools including Atoka Elementary School, Munford Middle School, and Munford High School.
Ownership History
Date
Name
Owned For
Owner Type
Purchase Details
Closed on
Feb 8, 2023
Sold by
Apex Home Builders Llc
Bought by
Eaton Neiman Terrance and Eaton Monica
Current Estimated Value
Home Financials for this Owner
Home Financials are based on the most recent Mortgage that was taken out on this home.
Original Mortgage
$377,950
Outstanding Balance
$365,568
Interest Rate
6.09%
Mortgage Type
New Conventional
Estimated Equity
-$63,645
Purchase Details
Closed on
Feb 28, 2005
Sold by
Bruce Hatcher
Bought by
Roscoe Bellows
Home Financials for this Owner
Home Financials are based on the most recent Mortgage that was taken out on this home.
Original Mortgage
$111,120
Interest Rate
6.35%
Purchase Details
Closed on
Sep 26, 2003
Bought by
Hatcher Christy Etvir Bruce
Home Financials for this Owner
Home Financials are based on the most recent Mortgage that was taken out on this home.
Original Mortgage
$61,000
Interest Rate
6.32%
Purchase Details
Closed on
Oct 16, 2002
Sold by
Munford Development Co
Bought by
Creative Development Inc
Create a Home Valuation Report for This Property
The Home Valuation Report is an in-depth analysis detailing your home's value as well as a comparison with similar homes in the area
Home Values in the Area
Average Home Value in this Area
Purchase History
| Date | Buyer | Sale Price | Title Company |
|---|---|---|---|
| Eaton Neiman Terrance | $419,950 | -- | |
| Roscoe Bellows | $138,900 | -- | |
| Hatcher Christy Etvir Bruce | $127,000 | -- | |
| Creative Development Inc | $30,000 | -- |
Source: Public Records
Mortgage History
| Date | Status | Borrower | Loan Amount |
|---|---|---|---|
| Open | Eaton Neiman Terrance | $377,950 | |
| Previous Owner | Creative Development Inc | $111,120 | |
| Previous Owner | Creative Development Inc | $27,780 | |
| Previous Owner | Creative Development Inc | $61,000 |
Source: Public Records
Tax History Compared to Growth
Tax History
| Year | Tax Paid | Tax Assessment Tax Assessment Total Assessment is a certain percentage of the fair market value that is determined by local assessors to be the total taxable value of land and additions on the property. | Land | Improvement |
|---|---|---|---|---|
| 2024 | $1,454 | $64,475 | $9,375 | $55,100 |
| 2023 | $1,454 | $64,475 | $9,375 | $55,100 |
| 2022 | $1,388 | $45,200 | $6,900 | $38,300 |
| 2021 | $1,365 | $45,200 | $6,900 | $38,300 |
| 2020 | $1,364 | $45,200 | $6,900 | $38,300 |
| 2019 | $1,282 | $35,700 | $5,325 | $30,375 |
| 2018 | $1,282 | $35,700 | $5,325 | $30,375 |
| 2017 | $1,150 | $35,700 | $5,325 | $30,375 |
| 2016 | $1,150 | $35,700 | $5,325 | $30,375 |
| 2015 | $1,148 | $35,700 | $5,325 | $30,375 |
| 2014 | $1,060 | $35,680 | $0 | $0 |
Source: Public Records
Map
Nearby Homes
- 256 Azalea Dr
- 91 Bethel Rd
- 0 Meade Lake Rd Unit 10196514
- 153 Ash Rene Dr
- 18 Fox Trot Ln
- 9700 N Helene Cove
- 95 Wallace Cove
- 512 Kearns Cir
- 01 Cobb Ave
- 02 Cobb Ave
- 03 Cobb Ave
- 33 Hattie Ln
- 13724 51 S Highway Hwy
- 1240 Je Blaydes Pkwy
- 595 Hickory Ln
- 39 Rose Bush St
- 9509 Merrill Rd
- 33 Rose Bush St
- 27 Rose Bush St
- 47 Rose Bush St