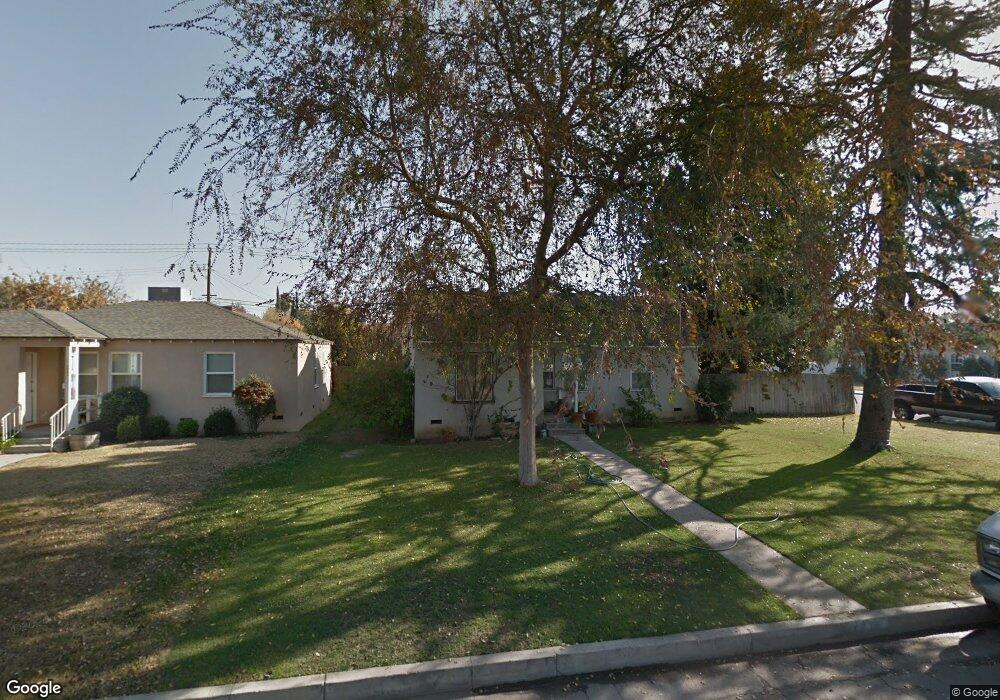
218 Cypress St Bakersfield, CA 93304
Oleander-Sunset NeighborhoodEstimated Value: $272,412 - $318,000
3
Beds
2
Baths
1,213
Sq Ft
$246/Sq Ft
Est. Value
About This Home
This home is located at 218 Cypress St, Bakersfield, CA 93304 and is currently estimated at $298,853, approximately $246 per square foot. 218 Cypress St is a home located in Kern County with nearby schools including Roosevelt Elementary School, Emerson Middle School, and Bakersfield High School.
Ownership History
Date
Name
Owned For
Owner Type
Purchase Details
Closed on
Jun 28, 2002
Sold by
Galvez Irene L
Bought by
Rodriguez Paul L and Rodriguez Teresa C
Current Estimated Value
Purchase Details
Closed on
Mar 1, 1994
Sold by
Register Marilyn Kay
Bought by
Galvez Irene
Home Financials for this Owner
Home Financials are based on the most recent Mortgage that was taken out on this home.
Original Mortgage
$63,000
Interest Rate
7.21%
Create a Home Valuation Report for This Property
The Home Valuation Report is an in-depth analysis detailing your home's value as well as a comparison with similar homes in the area
Home Values in the Area
Average Home Value in this Area
Purchase History
| Date | Buyer | Sale Price | Title Company |
|---|---|---|---|
| Rodriguez Paul L | -- | -- | |
| Galvez Irene | $70,000 | Chicago Title Company |
Source: Public Records
Mortgage History
| Date | Status | Borrower | Loan Amount |
|---|---|---|---|
| Previous Owner | Galvez Irene | $63,000 |
Source: Public Records
Tax History
| Year | Tax Paid | Tax Assessment Tax Assessment Total Assessment is a certain percentage of the fair market value that is determined by local assessors to be the total taxable value of land and additions on the property. | Land | Improvement |
|---|---|---|---|---|
| 2025 | $2,298 | $137,904 | $28,956 | $108,948 |
| 2024 | $2,247 | $135,201 | $28,389 | $106,812 |
| 2023 | $2,247 | $132,552 | $27,833 | $104,719 |
| 2022 | $2,189 | $129,954 | $27,288 | $102,666 |
| 2021 | $2,083 | $127,407 | $26,753 | $100,654 |
| 2020 | $2,047 | $126,102 | $26,479 | $99,623 |
| 2019 | $2,007 | $126,102 | $26,479 | $99,623 |
| 2018 | $1,962 | $121,208 | $25,451 | $95,757 |
| 2017 | $1,950 | $118,833 | $24,952 | $93,881 |
| 2016 | $1,799 | $116,504 | $24,463 | $92,041 |
| 2015 | $1,786 | $114,756 | $24,096 | $90,660 |
| 2014 | $1,589 | $100,000 | $25,000 | $75,000 |
Source: Public Records
Map
Nearby Homes
Your Personal Tour Guide
Ask me questions while you tour the home.