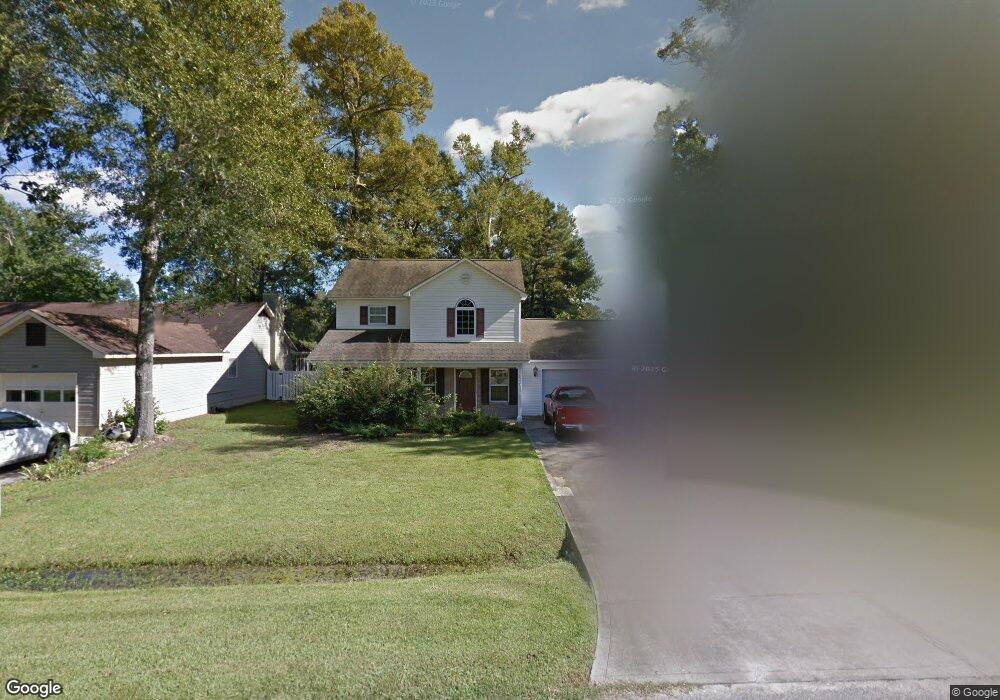
218 Deer Trace Cir Unit Cedar Trace Myrtle Beach, SC 29588
Burgess NeighborhoodEstimated Value: $316,000 - $342,000
3
Beds
2
Baths
2,750
Sq Ft
$119/Sq Ft
Est. Value
About This Home
This home is located at 218 Deer Trace Cir Unit Cedar Trace, Myrtle Beach, SC 29588 and is currently estimated at $327,503, approximately $119 per square foot. 218 Deer Trace Cir Unit Cedar Trace is a home located in Horry County with nearby schools including Burgess Elementary School, St. James Middle School, and St. James Intermediate.
Ownership History
Date
Name
Owned For
Owner Type
Purchase Details
Closed on
Aug 13, 2008
Sold by
Pasquarelli John A
Bought by
Klein Samuel David
Current Estimated Value
Purchase Details
Closed on
Jul 26, 2004
Sold by
Roberts Harry Lee
Bought by
Pasquarelli John A and Pasquarelli Michelle A
Home Financials for this Owner
Home Financials are based on the most recent Mortgage that was taken out on this home.
Original Mortgage
$159,900
Interest Rate
6.22%
Mortgage Type
Purchase Money Mortgage
Purchase Details
Closed on
Apr 2, 2001
Sold by
Grs Builders Inc
Bought by
Roberts Harry Lee
Purchase Details
Closed on
Jul 24, 2000
Sold by
Cuozzo Joseph A and Cuozzo Patricia
Bought by
Grs Builders Inc
Create a Home Valuation Report for This Property
The Home Valuation Report is an in-depth analysis detailing your home's value as well as a comparison with similar homes in the area
Home Values in the Area
Average Home Value in this Area
Purchase History
| Date | Buyer | Sale Price | Title Company |
|---|---|---|---|
| Klein Samuel David | $177,500 | -- | |
| Pasquarelli John A | $159,900 | -- | |
| Roberts Harry Lee | -- | -- | |
| Grs Builders Inc | $22,000 | -- |
Source: Public Records
Mortgage History
| Date | Status | Borrower | Loan Amount |
|---|---|---|---|
| Previous Owner | Pasquarelli John A | $159,900 |
Source: Public Records
Tax History Compared to Growth
Tax History
| Year | Tax Paid | Tax Assessment Tax Assessment Total Assessment is a certain percentage of the fair market value that is determined by local assessors to be the total taxable value of land and additions on the property. | Land | Improvement |
|---|---|---|---|---|
| 2024 | $814 | $11,875 | $2,644 | $9,231 |
| 2023 | $814 | $6,864 | $1,207 | $5,657 |
| 2021 | $739 | $10,016 | $1,312 | $8,704 |
| 2020 | $642 | $10,016 | $1,312 | $8,704 |
| 2019 | $642 | $10,016 | $1,312 | $8,704 |
| 2018 | $579 | $5,969 | $1,049 | $4,920 |
| 2017 | $564 | $5,969 | $1,049 | $4,920 |
| 2016 | -- | $5,969 | $1,049 | $4,920 |
| 2015 | $575 | $5,970 | $1,050 | $4,920 |
| 2014 | $532 | $5,970 | $1,050 | $4,920 |
Source: Public Records
Map
Nearby Homes
- 408 Empyrean Cir Unit lot 01
- CAMERON Plan at Sandpiper Place
- CURTIS Plan at Sandpiper Place
- CALI Plan at Sandpiper Place
- DEVON Plan at Sandpiper Place
- PERRY Plan at Sandpiper Place
- KERRY Plan at Sandpiper Place
- MANNING Plan at Sandpiper Place
- ARIA Plan at Sandpiper Place
- LEWIS Plan at Sandpiper Place
- 544 Fanciful Way
- 541 Fanciful Way
- 199 Empyrean Cir
- 176 Empyrean Cir
- 170 New Paradise Way
- 315 Kildare Ct
- 322 Kildare Ct
- 165 Osprey Cove Loop
- 892 Bonita Loop
- 156 Osprey Cove Loop
- 218 Deer Trace Cir
- 216 Deer Trace Cir Unit 216 Deer Trace Circl
- 220 Deer Trace Cir
- 214 Deer Trace Cir
- 239 Deer Trace Cir
- 121 Deer Trace Cir
- 237 Deer Trace Cir
- 235 Deer Trace Cir
- 212 Deer Trace Cir
- 301 Trace Run
- 119 Deer Trace Cir
- 225 Deer Trace Cir
- 117 Deer Trace Cir
- 408 Empyrean Cir Unit 1
- 210 Deer Trace Cir
- 233 Deer Trace Cir
- 115 Deer Trace Cir
- 300 Trace Run Unit DEER
- 223 Deer Trace Cir
- 303 Trace Run