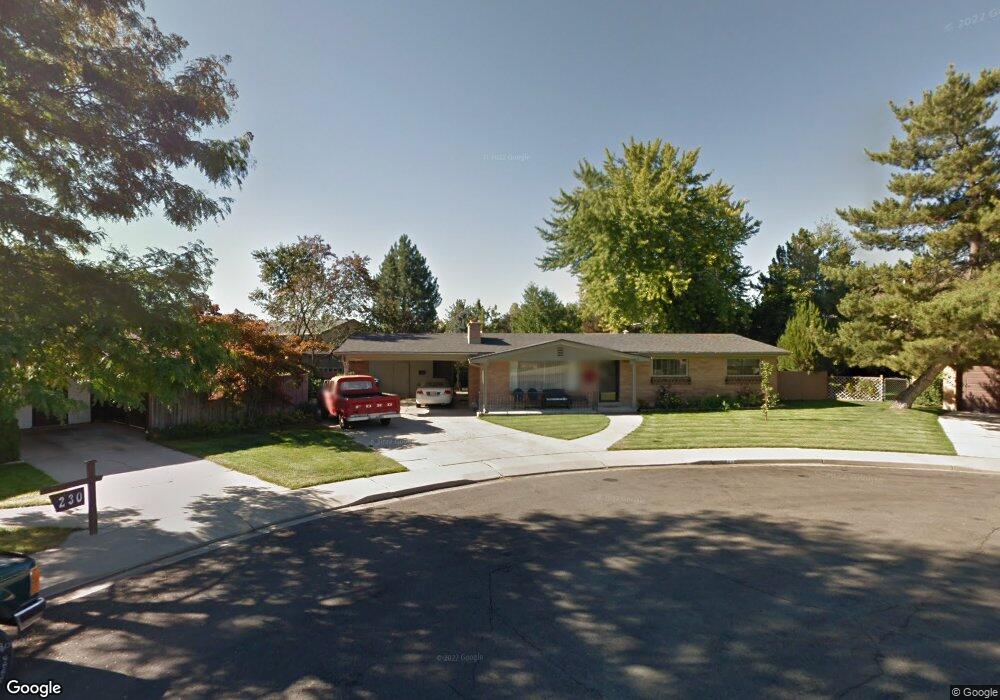
218 E 1910 S Orem, UT 84058
Cherry Hill NeighborhoodEstimated Value: $561,000 - $588,408
4
Beds
3
Baths
2,922
Sq Ft
$196/Sq Ft
Est. Value
About This Home
This home is located at 218 E 1910 S, Orem, UT 84058 and is currently estimated at $572,803, approximately $196 per square foot. 218 E 1910 S is a home located in Utah County with nearby schools including Cherry Hill Elementary School, Lakeridge Jr High School, and Mountain View High School.
Ownership History
Date
Name
Owned For
Owner Type
Purchase Details
Closed on
Oct 16, 2020
Sold by
Anderson Gayle Lynn and Gayle Lynn Anderson Frt
Bought by
Harris Nathan R and Harris Lori J
Current Estimated Value
Home Financials for this Owner
Home Financials are based on the most recent Mortgage that was taken out on this home.
Original Mortgage
$284,000
Outstanding Balance
$252,142
Interest Rate
2.8%
Mortgage Type
New Conventional
Estimated Equity
$320,661
Purchase Details
Closed on
Dec 13, 2017
Sold by
Anderson Gary Lee and Anderson Gayle Lynn
Bought by
Anderson Gayle Lynn and The Gayle Lynn Anderson Family
Purchase Details
Closed on
Mar 1, 2001
Sold by
Skoy Vernon
Bought by
Anderson Gary Lee and Anderson Gayle Lynn
Purchase Details
Closed on
Dec 6, 1999
Sold by
Givan Jo Ann H
Bought by
Thomas Daniel D and Thomas Lajune T
Home Financials for this Owner
Home Financials are based on the most recent Mortgage that was taken out on this home.
Original Mortgage
$90,000
Interest Rate
7.25%
Create a Home Valuation Report for This Property
The Home Valuation Report is an in-depth analysis detailing your home's value as well as a comparison with similar homes in the area
Home Values in the Area
Average Home Value in this Area
Purchase History
| Date | Buyer | Sale Price | Title Company |
|---|---|---|---|
| Harris Nathan R | -- | Steed Ttile Ins Agcy | |
| Anderson Gayle Lynn | -- | None Available | |
| Anderson Gary Lee | -- | First American Title Co | |
| Anderson Gary Lee | -- | First American Title Co | |
| Thomas Daniel D | -- | Backman Stewart Title |
Source: Public Records
Mortgage History
| Date | Status | Borrower | Loan Amount |
|---|---|---|---|
| Open | Harris Nathan R | $284,000 | |
| Previous Owner | Thomas Daniel D | $90,000 |
Source: Public Records
Tax History
| Year | Tax Paid | Tax Assessment Tax Assessment Total Assessment is a certain percentage of the fair market value that is determined by local assessors to be the total taxable value of land and additions on the property. | Land | Improvement |
|---|---|---|---|---|
| 2025 | $2,320 | $295,405 | -- | -- |
| 2024 | $2,320 | $283,635 | $0 | $0 |
| 2023 | $2,124 | $279,125 | $0 | $0 |
| 2022 | $2,070 | $263,560 | $0 | $0 |
| 2021 | $1,893 | $365,100 | $137,000 | $228,100 |
| 2020 | $1,747 | $331,100 | $109,600 | $221,500 |
| 2019 | $1,520 | $299,500 | $95,000 | $204,500 |
| 2018 | $1,491 | $280,800 | $91,300 | $189,500 |
| 2017 | $1,361 | $137,335 | $0 | $0 |
| 2016 | $1,310 | $121,880 | $0 | $0 |
| 2015 | $1,264 | $111,210 | $0 | $0 |
| 2014 | $1,148 | $100,540 | $0 | $0 |
Source: Public Records
Map
Nearby Homes
Your Personal Tour Guide
Ask me questions while you tour the home.