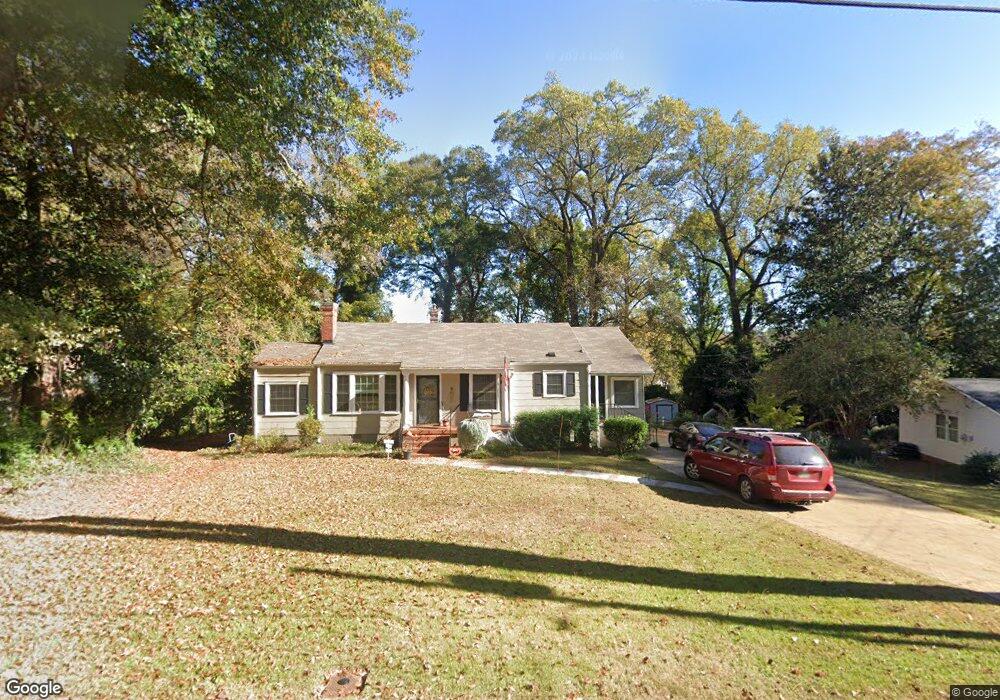
218 E Lane Cir Lagrange, GA 30240
Estimated Value: $270,047 - $317,000
3
Beds
2
Baths
2,121
Sq Ft
$141/Sq Ft
Est. Value
About This Home
This home is located at 218 E Lane Cir, Lagrange, GA 30240 and is currently estimated at $298,762, approximately $140 per square foot. 218 E Lane Cir is a home located in Troup County with nearby schools including Hollis Hand Elementary School, Ethel W. Kight Elementary School, and Franklin Forest Elementary School.
Ownership History
Date
Name
Owned For
Owner Type
Purchase Details
Closed on
Oct 11, 2016
Sold by
Lundy Charles R and Lundy Paige P
Bought by
Lockerbie Janet M and Lockerbie Brian D
Current Estimated Value
Purchase Details
Closed on
Apr 28, 2005
Sold by
Ferri Marcia Fountain
Bought by
Lundy Charley and Perdue Paige
Home Financials for this Owner
Home Financials are based on the most recent Mortgage that was taken out on this home.
Original Mortgage
$123,190
Interest Rate
5.98%
Mortgage Type
New Conventional
Purchase Details
Closed on
Feb 28, 1990
Sold by
Nell Kirkland Johnson
Bought by
Marcia Fountain Ferri
Purchase Details
Closed on
Nov 15, 1979
Sold by
Johnson Albert C and Johnson Nell K
Bought by
Nell Kirkland Johnson
Purchase Details
Closed on
Jan 1, 1968
Sold by
Paul S Jones
Bought by
Johnson Albert C and Johnson Nell K
Create a Home Valuation Report for This Property
The Home Valuation Report is an in-depth analysis detailing your home's value as well as a comparison with similar homes in the area
Purchase History
| Date | Buyer | Sale Price | Title Company |
|---|---|---|---|
| Lockerbie Janet M | $160,000 | -- | |
| Lundy Charley | $127,000 | -- | |
| Marcia Fountain Ferri | $81,400 | -- | |
| Nell Kirkland Johnson | -- | -- | |
| Johnson Albert C | -- | -- |
Source: Public Records
Mortgage History
| Date | Status | Borrower | Loan Amount |
|---|---|---|---|
| Previous Owner | Lundy Charley | $123,190 |
Source: Public Records
Tax History
| Year | Tax Paid | Tax Assessment Tax Assessment Total Assessment is a certain percentage of the fair market value that is determined by local assessors to be the total taxable value of land and additions on the property. | Land | Improvement |
|---|---|---|---|---|
| 2025 | $2,690 | $98,640 | $18,000 | $80,640 |
| 2024 | $2,362 | $86,600 | $18,000 | $68,600 |
| 2023 | $2,254 | $82,640 | $18,000 | $64,640 |
| 2022 | $2,207 | $79,080 | $18,000 | $61,080 |
| 2021 | $2,097 | $69,520 | $18,000 | $51,520 |
| 2020 | $2,097 | $69,520 | $18,000 | $51,520 |
| 2019 | $2,029 | $67,280 | $10,360 | $56,920 |
| 2018 | $1,947 | $64,560 | $10,360 | $54,200 |
| 2017 | $1,930 | $64,080 | $10,000 | $54,080 |
| 2016 | $968 | $34,095 | $10,000 | $24,095 |
| 2015 | $981 | $34,455 | $10,360 | $24,095 |
| 2014 | $968 | $33,958 | $10,360 | $23,598 |
| 2013 | -- | $38,786 | $10,400 | $28,386 |
Source: Public Records
Map
Nearby Homes
- 216 E Lane Cir
- 203 Waverly Way
- 598 Edmondson Ave
- 705 Piney Woods Dr
- 120 Saynor Cir
- 105 Saynor Cir
- 119 College Ave
- 208 Boulevard
- 217 Jefferson St
- 206 Broad St
- 304 Boulevard
- 0 N Lee St Unit 10550825
- 405 W Broome St Unit 2
- 405 W Broome St Unit 3
- 405 W Broome St Unit 4
- 405 W Broome St Unit 1
- 405 W Broome St Unit 5
- 910 Piney Woods Dr
- 416 Park Ave
- 421 College Ave
- 224 E Lane Cir
- E E Lane Cir Unit 2
- E E Lane Cir
- 228 E Lane Cir
- 221 E Lane Cir
- 217 E Lane Cir
- 214 E Lane Cir
- 225 E Lane Cir
- 309 Waverly Way
- 211 E Lane Cir
- 230 E Lane Cir
- 212 E Lane Cir
- 303 Waverly Way
- 509 Cherokee Rd
- 507 Cherokee Rd
- 312 Lane Cir
- 231 E Lane Cir
- 210 E Lane Cir
- 505 Cherokee Rd
- 505 Cherokee Rd Unit N/A
Your Personal Tour Guide
Ask me questions while you tour the home.