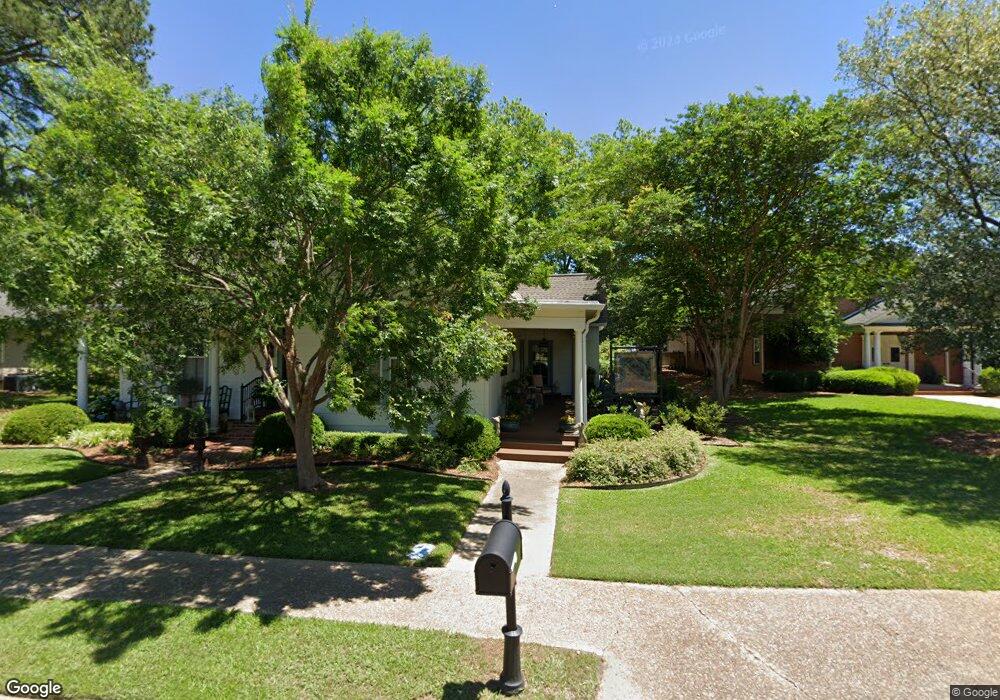
218 East St West Point, MS 39773
Estimated Value: $154,000 - $232,000
4
Beds
--
Bath
2,772
Sq Ft
$67/Sq Ft
Est. Value
About This Home
This home is located at 218 East St, West Point, MS 39773 and is currently estimated at $185,722, approximately $66 per square foot. 218 East St is a home located in Clay County with nearby schools including East Side Elementary School, West Clay Elementary School, and Church Hill Elementary School.
Ownership History
Date
Name
Owned For
Owner Type
Purchase Details
Closed on
Jan 22, 2021
Sold by
Palmer Leslie B and Cooper Martha L
Bought by
Grimes Polly Hunter
Current Estimated Value
Home Financials for this Owner
Home Financials are based on the most recent Mortgage that was taken out on this home.
Original Mortgage
$101,628
Outstanding Balance
$87,418
Interest Rate
2.71%
Mortgage Type
Credit Line Revolving
Estimated Equity
$98,304
Create a Home Valuation Report for This Property
The Home Valuation Report is an in-depth analysis detailing your home's value as well as a comparison with similar homes in the area
Home Values in the Area
Average Home Value in this Area
Purchase History
| Date | Buyer | Sale Price | Title Company |
|---|---|---|---|
| Grimes Polly Hunter | -- | None Listed On Document |
Source: Public Records
Mortgage History
| Date | Status | Borrower | Loan Amount |
|---|---|---|---|
| Open | Grimes Polly Hunter | $101,628 |
Source: Public Records
Tax History Compared to Growth
Tax History
| Year | Tax Paid | Tax Assessment Tax Assessment Total Assessment is a certain percentage of the fair market value that is determined by local assessors to be the total taxable value of land and additions on the property. | Land | Improvement |
|---|---|---|---|---|
| 2024 | $328 | $13,548 | $2,000 | $11,548 |
| 2023 | $905 | $13,548 | $2,000 | $11,548 |
| 2022 | $330 | $13,548 | $2,000 | $11,548 |
| 2021 | $1,039 | $19,192 | $3,000 | $16,192 |
| 2020 | $1,043 | $19,192 | $3,000 | $16,192 |
| 2019 | $267 | $12,696 | $2,000 | $10,696 |
| 2018 | $258 | $12,696 | $2,000 | $10,696 |
| 2017 | $258 | $12,696 | $2,000 | $10,696 |
| 2016 | $252 | $12,696 | $2,000 | $10,696 |
| 2015 | $235 | $12,241 | $2,000 | $10,241 |
| 2014 | $171 | $12,241 | $2,000 | $10,241 |
| 2013 | $171 | $12,241 | $2,000 | $10,241 |
Source: Public Records
Map
Nearby Homes
- 26788 E Main St
- 26852 E Main St
- 98 Court St
- 480 E Westbrook St
- 1104 E Broad St
- 238 Calhoun St
- 228 S Division St
- 1153 E Broad St
- 206 S Division St
- 229 S Division St
- 63 Clay St
- 1180 E Broad St
- 27045 E Main St
- 402 Cromwell St
- 346 E Brame Ave
- 530 E Morrow St
- 564 E Morrow St
- 556 Mccord St
- 228 Mccord St
- 194 Mccord St
- 524 E Jordan Ave
- 513 E Jordan Ave
- 535 E Jordan Ave
- 536 E Jordan Ave
- 520 E Jordan Ave
- 604 E Jordan Ave
- 48 Mulberry St
- 607 E Jordan Ave
- 608 E Broad St
- 440 East St
- 603 E Jordan Ave
- 623 E Jordan Ave
- 610 E Jordan Ave
- 314 East St
- 613 E Broad St
- 472 E Jordan Ave
- 629 E Jordan Ave
- 616 E Jordan Ave
- 622 E Jordan Ave
- 26620 E Main St