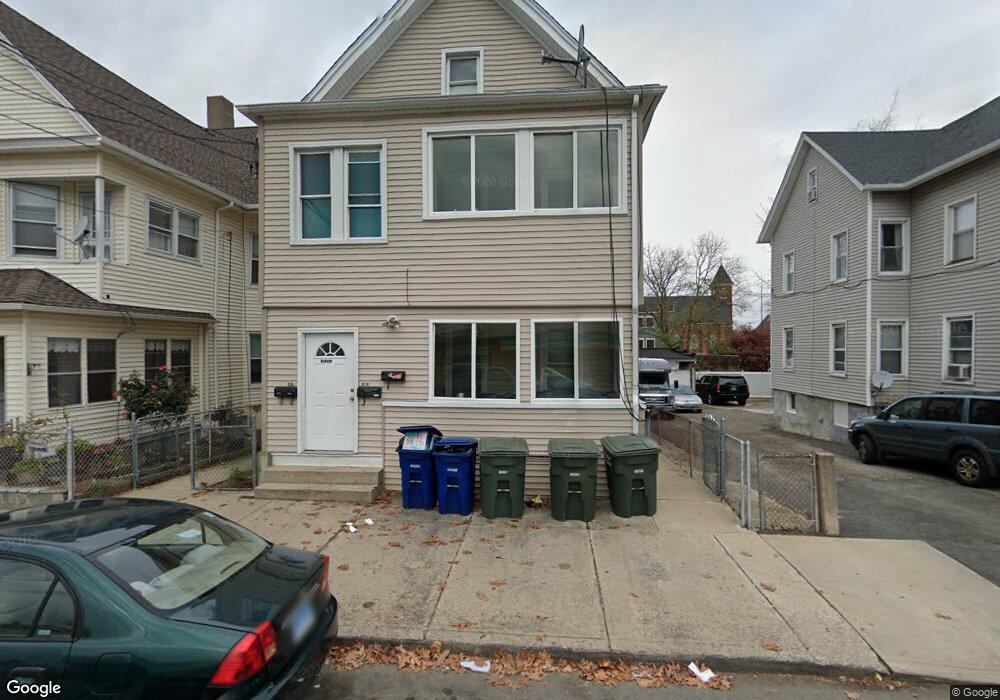
218 Frank St Unit 220 Bridgeport, CT 06604
The Hollow NeighborhoodEstimated Value: $356,528 - $577,000
6
Beds
3
Baths
2,998
Sq Ft
$153/Sq Ft
Est. Value
About This Home
This home is located at 218 Frank St Unit 220, Bridgeport, CT 06604 and is currently estimated at $458,382, approximately $152 per square foot. 218 Frank St Unit 220 is a home located in Fairfield County with nearby schools including Bassick High School, Catholic Academy of Bridgeport-St. Raphael Academy, and Catholic Academy of Bridgeport-St. Augustine Academy.
Ownership History
Date
Name
Owned For
Owner Type
Purchase Details
Closed on
Jul 28, 2017
Sold by
Minte Colin
Bought by
Tri State Property Llc
Current Estimated Value
Home Financials for this Owner
Home Financials are based on the most recent Mortgage that was taken out on this home.
Original Mortgage
$410,000
Outstanding Balance
$340,002
Interest Rate
3.91%
Mortgage Type
Future Advance Clause Open End Mortgage
Estimated Equity
$118,380
Purchase Details
Closed on
Sep 29, 2008
Sold by
Private Transerve Llc
Bought by
Tartaglia 3Rd John and Minte Colin S
Home Financials for this Owner
Home Financials are based on the most recent Mortgage that was taken out on this home.
Original Mortgage
$227,500
Interest Rate
6.57%
Mortgage Type
Purchase Money Mortgage
Purchase Details
Closed on
Mar 28, 2008
Sold by
Sforza Giovanna
Bought by
Private Transerve Llc
Create a Home Valuation Report for This Property
The Home Valuation Report is an in-depth analysis detailing your home's value as well as a comparison with similar homes in the area
Home Values in the Area
Average Home Value in this Area
Purchase History
| Date | Buyer | Sale Price | Title Company |
|---|---|---|---|
| Tri State Property Llc | $204,153 | -- | |
| Tri State Property Llc | $204,153 | -- | |
| Tartaglia 3Rd John | $325,000 | -- | |
| Tartaglia 3Rd John | $325,000 | -- | |
| Private Transerve Llc | $95,000 | -- | |
| Private Transerve Llc | $95,000 | -- |
Source: Public Records
Mortgage History
| Date | Status | Borrower | Loan Amount |
|---|---|---|---|
| Open | Private Transerve Llc | $410,000 | |
| Closed | Private Transerve Llc | $410,000 | |
| Previous Owner | Private Transerve Llc | $227,500 |
Source: Public Records
Tax History Compared to Growth
Tax History
| Year | Tax Paid | Tax Assessment Tax Assessment Total Assessment is a certain percentage of the fair market value that is determined by local assessors to be the total taxable value of land and additions on the property. | Land | Improvement |
|---|---|---|---|---|
| 2025 | $6,470 | $148,910 | $35,220 | $113,690 |
| 2024 | $6,470 | $148,910 | $35,220 | $113,690 |
| 2023 | $6,470 | $148,910 | $35,220 | $113,690 |
| 2022 | $6,470 | $148,910 | $35,220 | $113,690 |
| 2021 | $6,470 | $148,910 | $35,220 | $113,690 |
| 2020 | $5,997 | $111,080 | $16,680 | $94,400 |
| 2019 | $5,997 | $111,080 | $16,680 | $94,400 |
| 2018 | $6,039 | $111,080 | $16,680 | $94,400 |
| 2017 | $6,039 | $111,080 | $16,680 | $94,400 |
| 2016 | $6,039 | $111,080 | $16,680 | $94,400 |
| 2015 | $6,755 | $160,060 | $34,730 | $125,330 |
| 2014 | $6,755 | $160,060 | $34,730 | $125,330 |
Source: Public Records
Map
Nearby Homes
- 318 Center St
- 191 Oak St
- 183 Calhoun Ave
- 139 Highland Ave Unit 143
- 78 Fairmount Ave
- 90 Tom Thumb St
- 75 Sanford Ave
- 309 Pequonnock St
- 31 Taft Ave
- 113 Milne St Unit 115
- 100 Lorraine St
- 76 Porter St
- 213 Harral Ave Unit 215
- 200 Harral Ave
- 390 Charles St Unit 106
- 2395 Main St Unit 2397
- 356 Taft Ave
- 79 William St
- 1872 North Ave Unit 1874
- 724 Capitol Ave Unit 726
- 218 Frank St Unit 3RD
- 218 Frank St Unit 2ND
- 218 Frank St Unit 1ST
- 226 Frank St Unit 228
- 234 Frank St Unit 236
- 382 Catherine St
- 285 Madison Ave Unit 6604
- 285 Madison Ave Unit 6
- 285 Madison Ave Unit 5
- 285 Madison Ave Unit 8
- 285 Madison Ave Unit 2
- 285 Madison Ave
- 388 Catherine St
- 206 Frank St Unit 208
- 293 Madison Ave Unit 297
- 293 Madison Ave
- 293 Madison Ave Unit 2
- 363 Catherine St Unit 365
- 295 Madison Ave
- 371 Catherine St Unit 373