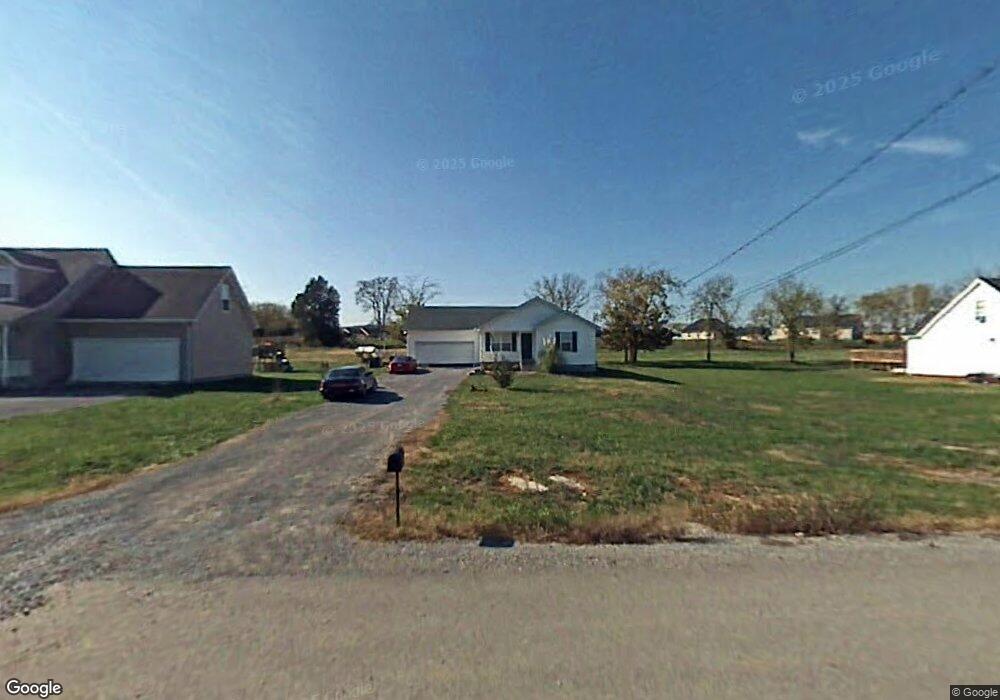
218 Hayden Ct Murfreesboro, TN 37129
Estimated Value: $297,391 - $369,000
Studio
2
Baths
1,309
Sq Ft
$265/Sq Ft
Est. Value
About This Home
This home is located at 218 Hayden Ct, Murfreesboro, TN 37129 and is currently estimated at $346,848, approximately $264 per square foot. 218 Hayden Ct is a home located in Rutherford County with nearby schools including Brown's Chapel Elementary School, Stewarts Creek Middle School, and Stewarts Creek High School.
Ownership History
Date
Name
Owned For
Owner Type
Purchase Details
Closed on
May 18, 2010
Sold by
Hud Secretary Of
Bought by
Gallagher Aaron Ford
Current Estimated Value
Home Financials for this Owner
Home Financials are based on the most recent Mortgage that was taken out on this home.
Original Mortgage
$95,200
Outstanding Balance
$63,746
Interest Rate
5.03%
Estimated Equity
$283,102
Purchase Details
Closed on
Oct 6, 2009
Sold by
Apple Michael
Bought by
Hud Secretary Of
Create a Home Valuation Report for This Property
The Home Valuation Report is an in-depth analysis detailing your home's value as well as a comparison with similar homes in the area
Home Values in the Area
Average Home Value in this Area
Purchase History
| Date | Buyer | Sale Price | Title Company |
|---|---|---|---|
| Gallagher Aaron Ford | $119,000 | -- | |
| Hud Secretary Of | $115,552 | -- |
Source: Public Records
Mortgage History
| Date | Status | Borrower | Loan Amount |
|---|---|---|---|
| Open | Hud Secretary Of | $95,200 |
Source: Public Records
Tax History
| Year | Tax Paid | Tax Assessment Tax Assessment Total Assessment is a certain percentage of the fair market value that is determined by local assessors to be the total taxable value of land and additions on the property. | Land | Improvement |
|---|---|---|---|---|
| 2025 | $1,254 | $66,825 | $13,750 | $53,075 |
| 2024 | $1,254 | $66,825 | $13,750 | $53,075 |
| 2023 | $1,254 | $66,825 | $13,750 | $53,075 |
| 2022 | $1,080 | $66,825 | $13,750 | $53,075 |
| 2021 | $1,065 | $47,975 | $9,375 | $38,600 |
| 2020 | $1,065 | $47,975 | $9,375 | $38,600 |
| 2019 | $1,065 | $47,975 | $9,375 | $38,600 |
| 2018 | $1,007 | $47,975 | $0 | $0 |
| 2017 | $847 | $31,600 | $0 | $0 |
| 2016 | $847 | $31,600 | $0 | $0 |
| 2015 | $847 | $31,600 | $0 | $0 |
| 2014 | $786 | $31,600 | $0 | $0 |
| 2013 | -- | $31,725 | $0 | $0 |
Source: Public Records
Map
Nearby Homes
Your Personal Tour Guide
Ask me questions while you tour the home.