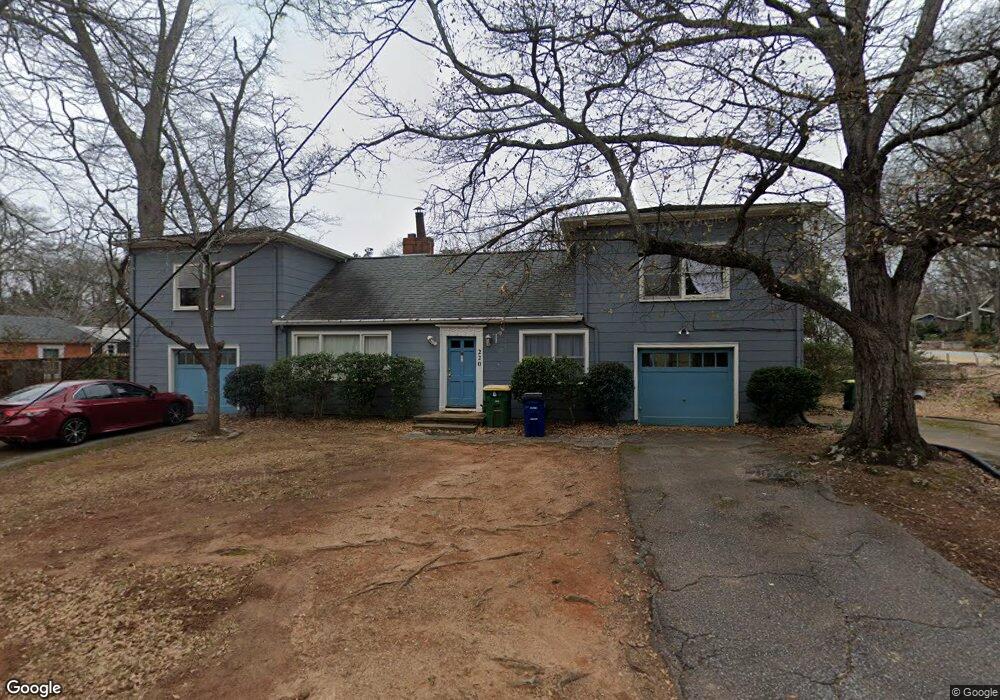
218 Hillcrest Ave Athens, GA 30606
Normaltown NeighborhoodEstimated Value: $410,000 - $564,000
--
Bed
3
Baths
1,650
Sq Ft
$302/Sq Ft
Est. Value
About This Home
This home is located at 218 Hillcrest Ave, Athens, GA 30606 and is currently estimated at $498,323, approximately $302 per square foot. 218 Hillcrest Ave is a home located in Clarke County with nearby schools including Johnnie Lay Burks Elementary School, Clarke Middle School, and Clarke Central High School.
Ownership History
Date
Name
Owned For
Owner Type
Purchase Details
Closed on
Sep 5, 2019
Sold by
Hall Matthew I
Bought by
Perch And Trout Llc and C/O Blasingame Burch Garrard & Ashley Pc
Current Estimated Value
Purchase Details
Closed on
Mar 5, 2018
Sold by
Reynolds
Bought by
Hall Matthew I and Gilbertson Erica L
Home Financials for this Owner
Home Financials are based on the most recent Mortgage that was taken out on this home.
Original Mortgage
$187,331
Interest Rate
4.22%
Mortgage Type
New Conventional
Purchase Details
Closed on
Feb 27, 2009
Sold by
Hip Properties Llc
Bought by
Reynolds Richard
Purchase Details
Closed on
Sep 19, 2005
Sold by
Lawson Leslie
Bought by
Hip Properties Llc
Purchase Details
Closed on
Jun 15, 2005
Sold by
Lawson Leslie
Bought by
Lawson John David
Purchase Details
Closed on
Aug 23, 2002
Sold by
Bondurant John P Mrs
Bought by
Waverly Court Houses Llc
Create a Home Valuation Report for This Property
The Home Valuation Report is an in-depth analysis detailing your home's value as well as a comparison with similar homes in the area
Home Values in the Area
Average Home Value in this Area
Purchase History
| Date | Buyer | Sale Price | Title Company |
|---|---|---|---|
| Perch And Trout Llc | -- | -- | |
| Hall Matthew I | $249,775 | -- | |
| Reynolds Richard | $185,000 | -- | |
| Hip Properties Llc | -- | -- | |
| Lawson Leslie | -- | -- | |
| Lawson John David | -- | -- | |
| Lawson Leslie | -- | -- | |
| Lawson John David | -- | -- | |
| Lawson Leslie | $140,000 | -- | |
| Waverly Court Houses Llc | -- | -- |
Source: Public Records
Mortgage History
| Date | Status | Borrower | Loan Amount |
|---|---|---|---|
| Previous Owner | Hall Matthew I | $187,331 |
Source: Public Records
Tax History Compared to Growth
Tax History
| Year | Tax Paid | Tax Assessment Tax Assessment Total Assessment is a certain percentage of the fair market value that is determined by local assessors to be the total taxable value of land and additions on the property. | Land | Improvement |
|---|---|---|---|---|
| 2025 | $4,748 | $152,913 | $55,000 | $97,913 |
| 2024 | $4,748 | $141,857 | $55,000 | $86,857 |
| 2023 | $4,433 | $126,388 | $50,000 | $76,388 |
| 2022 | $3,746 | $117,444 | $50,000 | $67,444 |
| 2021 | $3,590 | $106,532 | $50,000 | $56,532 |
| 2020 | $3,422 | $101,532 | $45,000 | $56,532 |
| 2019 | $3,277 | $96,532 | $40,000 | $56,532 |
| 2018 | $2,851 | $83,969 | $40,000 | $43,969 |
| 2017 | $2,851 | $83,969 | $40,000 | $43,969 |
| 2016 | $2,851 | $83,969 | $40,000 | $43,969 |
| 2015 | $2,685 | $78,969 | $35,000 | $43,969 |
| 2014 | $2,538 | $74,533 | $30,000 | $44,533 |
Source: Public Records
Map
Nearby Homes
- 283 King Ave
- 552 Cobb St
- 480 N Billups St
- 1196 W Hancock Ave Unit 1
- 1198 W West Hancock Ave W
- 1398 W Hancock Ave
- 100 Crestview Cir
- 525 King Ave
- 1226 W Broad St
- 468 N Milledge Ave Unit 203
- 163 Easy St
- 597 Dearing St
- 500 Dearing St Unit 6
- 215 Holman Ave
- 145 Sunset Dr
- 257 Hill St
- 570 Prince Ave
- 390 Best Dr
- 947 N Chase St
- 195 Beulah Ave
- 218 Hillcrest Ave Unit 220
- 923 Hill St
- 897 Hill St
- 240 Hillcrest Ave
- 120 Waverly Ct
- 927 Hill St
- 225 Hillcrest Ave
- 180 Waverly Ct
- 235 Hillcrest Ave
- 931 Hill St
- 0 Hillcrest Ave Unit 7164317
- 0 Hillcrest Ave Unit 7149655
- 0 Hillcrest Ave Unit 8645402
- 0 Hillcrest Ave Unit 8388282
- 0 Hillcrest Ave Unit 8348837
- 0 Hillcrest Ave Unit 7550514
- 0 Hillcrest Ave
- 255 Hillcrest Ave
- 0 Waverly Ct Unit 8098408
- 0 Waverly Ct Unit 7310662