Estimated Value: $266,307 - $287,000
5
Beds
2
Baths
1,944
Sq Ft
$141/Sq Ft
Est. Value
About This Home
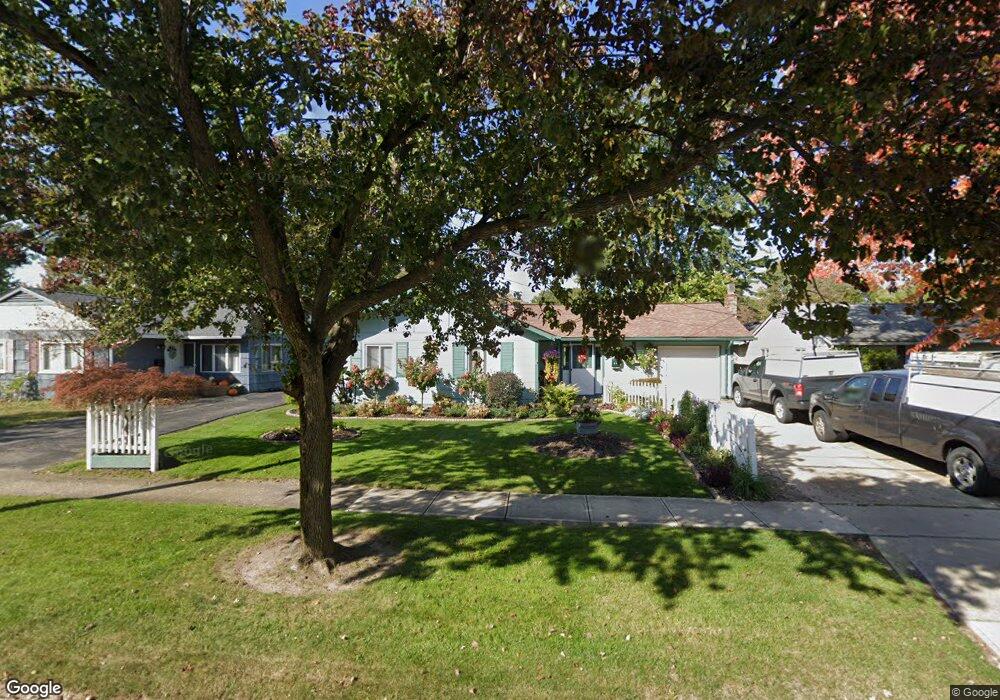
This home is located at 218 Jananna Dr, Berea, OH 44017 and is currently estimated at $274,577, approximately $141 per square foot. 218 Jananna Dr is a home located in Cuyahoga County with nearby schools including Grindstone Elementary School, Berea-Midpark Middle School, and Berea-Midpark High School.
Ownership History
Date
Name
Owned For
Owner Type
Purchase Details
Closed on
Mar 22, 2001
Sold by
Gibbons James and Gibbons Michelle
Bought by
Gibbons James and Gibbons Michelle
Current Estimated Value
Purchase Details
Closed on
Sep 8, 1999
Sold by
Marquart Kevin D
Bought by
Gibbons James R and Gibbons Michele J
Home Financials for this Owner
Home Financials are based on the most recent Mortgage that was taken out on this home.
Original Mortgage
$78,500
Outstanding Balance
$23,183
Interest Rate
7.77%
Estimated Equity
$251,394
Purchase Details
Closed on
Sep 22, 1995
Sold by
Discenzo Andrew J
Bought by
Marquart Kevin D
Home Financials for this Owner
Home Financials are based on the most recent Mortgage that was taken out on this home.
Original Mortgage
$111,180
Interest Rate
7.78%
Mortgage Type
VA
Purchase Details
Closed on
Feb 23, 1990
Sold by
Stropko Emily M
Bought by
Discenzo Andrew J
Purchase Details
Closed on
Jan 1, 1975
Bought by
Stropko Emily M
Create a Home Valuation Report for This Property
The Home Valuation Report is an in-depth analysis detailing your home's value as well as a comparison with similar homes in the area
Home Values in the Area
Average Home Value in this Area
Purchase History
| Date | Buyer | Sale Price | Title Company |
|---|---|---|---|
| Gibbons James | -- | Liberty Title Ins Agency Inc | |
| Gibbons James R | $122,500 | Pta | |
| Marquart Kevin D | $109,000 | -- | |
| Discenzo Andrew J | $75,000 | -- | |
| Stropko Emily M | -- | -- |
Source: Public Records
Mortgage History
| Date | Status | Borrower | Loan Amount |
|---|---|---|---|
| Open | Gibbons James R | $78,500 | |
| Closed | Marquart Kevin D | $111,180 |
Source: Public Records
Tax History Compared to Growth
Tax History
| Year | Tax Paid | Tax Assessment Tax Assessment Total Assessment is a certain percentage of the fair market value that is determined by local assessors to be the total taxable value of land and additions on the property. | Land | Improvement |
|---|---|---|---|---|
| 2024 | $4,747 | $82,145 | $11,760 | $70,385 |
| 2023 | $4,037 | $58,450 | $10,010 | $48,440 |
| 2022 | $4,011 | $58,450 | $10,010 | $48,440 |
| 2021 | $3,977 | $58,450 | $10,010 | $48,440 |
| 2020 | $3,799 | $49,530 | $8,470 | $41,060 |
| 2019 | $3,698 | $141,500 | $24,200 | $117,300 |
| 2018 | $3,474 | $49,530 | $8,470 | $41,060 |
| 2017 | $3,509 | $43,860 | $7,840 | $36,020 |
| 2016 | $3,483 | $43,860 | $7,840 | $36,020 |
| 2015 | $3,465 | $43,860 | $7,840 | $36,020 |
| 2014 | $3,465 | $46,170 | $8,260 | $37,910 |
Source: Public Records
Map
Nearby Homes
- 740 Fair St
- 243 Jananna Dr
- 148 Meadow Cir
- 104 Whitehall Dr
- 8036 Fair Rd
- 84 Sprague Rd
- 74 Aaron St
- 23 Hamilton St
- 255 Fairpark Dr
- 458 Sprague Rd
- 8627 Courtland Dr
- 648 Tampico Ct Unit 37
- 23004 Chandlers Ln Unit 109
- 23003 Chandlers Ln Unit 230
- 626 Ensenada Ct Unit 5
- 8902 Lincolnshire Blvd
- 412 Wyleswood Dr
- 214 Race St
- 23002 Chandlers Ln
- 23002 Chandlers Ln Unit 342