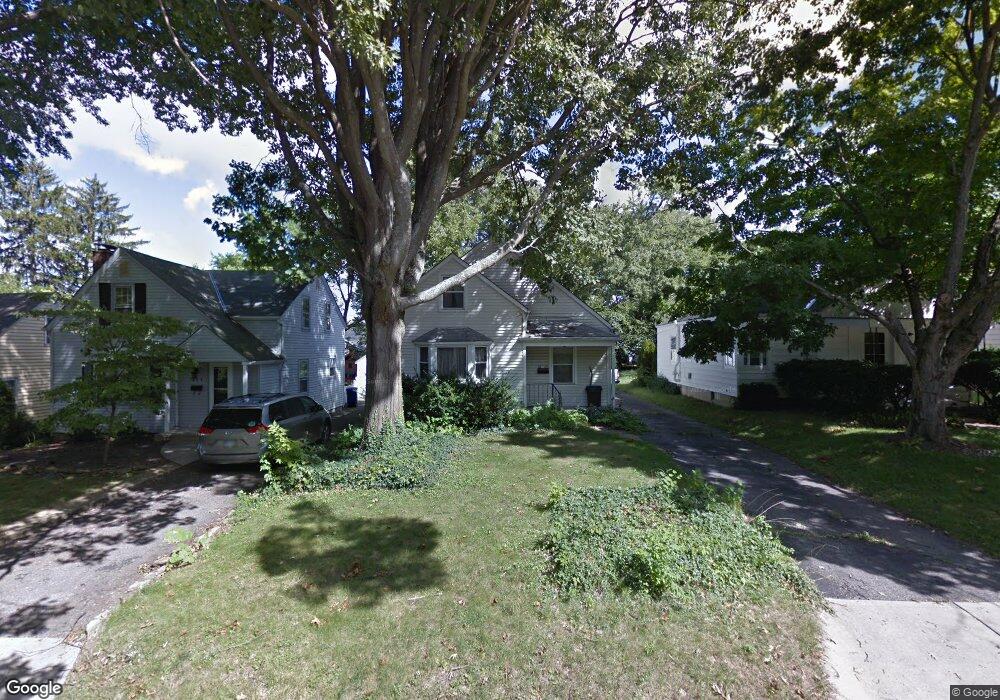
218 Leland Ave Columbus, OH 43214
Clintonville NeighborhoodEstimated Value: $245,000 - $320,000
3
Beds
2
Baths
1,148
Sq Ft
$261/Sq Ft
Est. Value
About This Home
This home is located at 218 Leland Ave, Columbus, OH 43214 and is currently estimated at $299,100, approximately $260 per square foot. 218 Leland Ave is a home located in Franklin County with nearby schools including Indian Springs Elementary School, Dominion Middle School, and Whetstone High School.
Ownership History
Date
Name
Owned For
Owner Type
Purchase Details
Closed on
Nov 13, 2023
Sold by
Kaufman Eric M
Bought by
Neuenschwander Steven
Current Estimated Value
Home Financials for this Owner
Home Financials are based on the most recent Mortgage that was taken out on this home.
Original Mortgage
$125,130
Outstanding Balance
$123,001
Interest Rate
7.63%
Mortgage Type
New Conventional
Estimated Equity
$176,099
Purchase Details
Closed on
Dec 4, 1995
Sold by
Cellar Denesa M
Bought by
Eric M Kaufman
Home Financials for this Owner
Home Financials are based on the most recent Mortgage that was taken out on this home.
Original Mortgage
$78,850
Interest Rate
7.44%
Mortgage Type
New Conventional
Purchase Details
Closed on
Nov 9, 1993
Purchase Details
Closed on
Feb 4, 1991
Create a Home Valuation Report for This Property
The Home Valuation Report is an in-depth analysis detailing your home's value as well as a comparison with similar homes in the area
Home Values in the Area
Average Home Value in this Area
Purchase History
| Date | Buyer | Sale Price | Title Company |
|---|---|---|---|
| Neuenschwander Steven | $129,000 | Amrock | |
| Eric M Kaufman | $83,000 | -- | |
| -- | -- | -- | |
| -- | $65,000 | -- |
Source: Public Records
Mortgage History
| Date | Status | Borrower | Loan Amount |
|---|---|---|---|
| Open | Neuenschwander Steven | $125,130 | |
| Previous Owner | Eric M Kaufman | $78,850 |
Source: Public Records
Tax History Compared to Growth
Tax History
| Year | Tax Paid | Tax Assessment Tax Assessment Total Assessment is a certain percentage of the fair market value that is determined by local assessors to be the total taxable value of land and additions on the property. | Land | Improvement |
|---|---|---|---|---|
| 2024 | $3,783 | $84,290 | $32,170 | $52,120 |
| 2023 | $3,735 | $84,290 | $32,170 | $52,120 |
| 2022 | $3,326 | $64,120 | $14,350 | $49,770 |
| 2021 | $3,332 | $64,120 | $14,350 | $49,770 |
| 2020 | $3,336 | $64,120 | $14,350 | $49,770 |
| 2019 | $2,994 | $49,360 | $11,030 | $38,330 |
| 2018 | $2,531 | $49,360 | $11,030 | $38,330 |
| 2017 | $2,638 | $49,360 | $11,030 | $38,330 |
| 2016 | $2,284 | $34,480 | $14,950 | $19,530 |
| 2015 | $2,073 | $34,480 | $14,950 | $19,530 |
| 2014 | $2,078 | $34,480 | $14,950 | $19,530 |
| 2013 | $976 | $32,830 | $14,245 | $18,585 |
Source: Public Records
Map
Nearby Homes
- 202 Rathbone Ave
- 116 Rathbone Ave
- 93 Leland Ave
- 4 W Royal Forest Blvd
- 371 Olentangy Forest Dr Unit 6C
- 264 Fenway Rd
- 5255 Fenway Place Unit D
- 409 Fenway Rd
- 270 Westview Ave
- 252 W Kanawha Ave
- 33 Rosslyn Ave
- 511 W Kanawha Ave
- 131 Broad Meadows Blvd
- 652 Olde Towne Ave Unit 9-652E
- 652 Olde Towne Ave Unit 9-652 G
- 87 Charleston Ave
- 162 Broad Meadows Blvd
- 156 E Weisheimer Rd
- 4464 Zeller Rd
- 142 W Schreyer Place