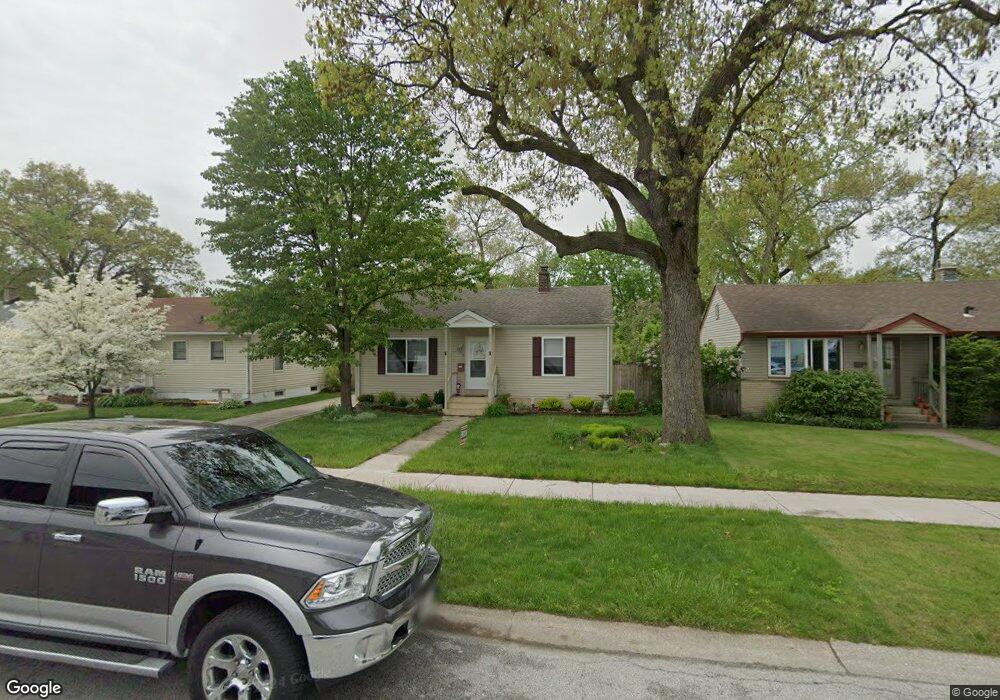
218 N Lindberg St Griffith, IN 46319
Estimated Value: $235,000 - $329,000
3
Beds
1
Bath
1,224
Sq Ft
$218/Sq Ft
Est. Value
About This Home
This home is located at 218 N Lindberg St, Griffith, IN 46319 and is currently estimated at $266,260, approximately $217 per square foot. 218 N Lindberg St is a home located in Lake County with nearby schools including Griffith Senior High School, St Mary School, and Calumet Christian School.
Ownership History
Date
Name
Owned For
Owner Type
Purchase Details
Closed on
Apr 28, 2011
Sold by
Boerman Construction Inc
Bought by
Mosqueda Lisa A
Current Estimated Value
Home Financials for this Owner
Home Financials are based on the most recent Mortgage that was taken out on this home.
Original Mortgage
$136,353
Outstanding Balance
$92,828
Interest Rate
4.75%
Mortgage Type
FHA
Estimated Equity
$173,432
Purchase Details
Closed on
Oct 25, 2010
Sold by
The Secretary Of Veterans Affairs
Bought by
Boerman Construction Inc
Purchase Details
Closed on
Jul 22, 2010
Sold by
Wells Fargo Bank Na
Bought by
The Secretary Of Veterans Affairs
Purchase Details
Closed on
Jul 9, 2010
Sold by
Spisak Steven F
Bought by
Wells Fargo Bank Na
Create a Home Valuation Report for This Property
The Home Valuation Report is an in-depth analysis detailing your home's value as well as a comparison with similar homes in the area
Home Values in the Area
Average Home Value in this Area
Purchase History
| Date | Buyer | Sale Price | Title Company |
|---|---|---|---|
| Mosqueda Lisa A | -- | Fidelity Cp | |
| Boerman Construction Inc | -- | Fidelity Highland | |
| The Secretary Of Veterans Affairs | -- | None Available | |
| Wells Fargo Bank Na | $44,946 | None Available |
Source: Public Records
Mortgage History
| Date | Status | Borrower | Loan Amount |
|---|---|---|---|
| Open | Mosqueda Lisa A | $136,353 |
Source: Public Records
Tax History
| Year | Tax Paid | Tax Assessment Tax Assessment Total Assessment is a certain percentage of the fair market value that is determined by local assessors to be the total taxable value of land and additions on the property. | Land | Improvement |
|---|---|---|---|---|
| 2025 | $2,322 | $225,100 | $30,000 | $195,100 |
| 2024 | $6,427 | $203,900 | $30,000 | $173,900 |
| 2023 | $2,089 | $196,200 | $30,000 | $166,200 |
| 2022 | $2,089 | $182,600 | $30,000 | $152,600 |
| 2021 | $949 | $104,200 | $25,200 | $79,000 |
| 2020 | $954 | $101,500 | $25,200 | $76,300 |
| 2019 | $1,008 | $98,700 | $25,200 | $73,500 |
| 2018 | $786 | $85,300 | $24,000 | $61,300 |
| 2017 | $790 | $85,700 | $24,000 | $61,700 |
| 2016 | $858 | $86,400 | $24,000 | $62,400 |
| 2014 | $766 | $81,600 | $24,000 | $57,600 |
| 2013 | $753 | $79,100 | $24,000 | $55,100 |
Source: Public Records
Map
Nearby Homes
- 706 W Lake St
- 314 N Cline Ave
- 423 N Cline Ave
- 342 N Wright St
- 408 N Griffith Blvd
- 614 W Elm St
- 405 N Griffith Blvd
- 338 N Lafayette St
- 539 N Raymond St
- 132 S Elgin Ave
- 606 N Lindberg St
- 238 N Indiana St
- 219 S Broad St
- 139 N Indiana St
- 123 S Lillian Ave
- 308 S Broad St Unit 12
- 707 N Ernest St
- 1703 S Fairbanks St
- 715 N Harvey St
- 225 N Dwiggins St
- 214 N Lindberg St
- 222 N Lindberg St
- 210 N Lindberg St
- 226 N Lindberg St
- 219 N Raymond St
- 215 N Raymond St
- 221 N Raymond St
- 230 N Lindberg St
- 206 N Lindberg St
- 209 N Raymond St
- 223 N Raymond St
- 202 N Lindberg St
- 234 N Lindberg St
- 234 N Lindberg St
- 207 N Raymond St
- 231 N Raymond St
- 201 N Raymond St
- 235 N Raymond St
- 238 N Lindberg St
- 207 N Lindberg St
Your Personal Tour Guide
Ask me questions while you tour the home.