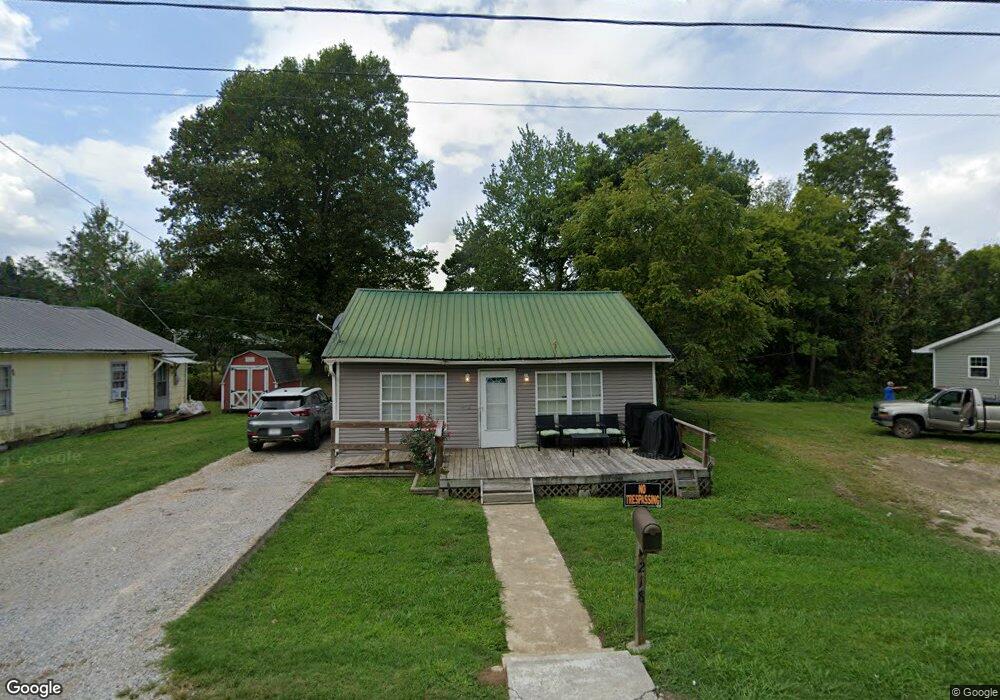
218 N Pine St Hohenwald, TN 38462
Estimated Value: $20,106 - $187,000
--
Bed
1
Bath
1,222
Sq Ft
$101/Sq Ft
Est. Value
About This Home
This home is located at 218 N Pine St, Hohenwald, TN 38462 and is currently estimated at $124,027, approximately $101 per square foot. 218 N Pine St is a home located in Lewis County with nearby schools including Lewis County Elementary School, Lewis County Intermediate School, and Lewis County Middle School.
Ownership History
Date
Name
Owned For
Owner Type
Purchase Details
Closed on
Oct 3, 2025
Sold by
Tripp Ashley and Pugh Ashley
Bought by
Runions Paula
Current Estimated Value
Home Financials for this Owner
Home Financials are based on the most recent Mortgage that was taken out on this home.
Original Mortgage
$58,200
Outstanding Balance
$58,200
Interest Rate
6.58%
Mortgage Type
New Conventional
Estimated Equity
$65,827
Purchase Details
Closed on
May 22, 2014
Sold by
Tripp Odell
Bought by
Mcright David R
Purchase Details
Closed on
Jul 1, 2003
Sold by
Willis Dol
Bought by
Tripp Ashley and Tripp Odell
Purchase Details
Closed on
May 24, 2001
Bought by
Willis Dol Arzell
Purchase Details
Closed on
Nov 17, 1997
Sold by
Willis Dol
Bought by
Himes Elton and Himes Heather
Purchase Details
Closed on
Jun 23, 1997
Sold by
Pevahouse William Russell
Bought by
Willis Dol
Purchase Details
Closed on
Dec 7, 1995
Bought by
Pevahouse William R and Pevahouse Naom
Create a Home Valuation Report for This Property
The Home Valuation Report is an in-depth analysis detailing your home's value as well as a comparison with similar homes in the area
Home Values in the Area
Average Home Value in this Area
Purchase History
| Date | Buyer | Sale Price | Title Company |
|---|---|---|---|
| Runions Paula | $60,000 | Rocket Close | |
| Mcright David R | $7,000 | -- | |
| Tripp Ashley | $20,000 | -- | |
| Willis Dol Arzell | $18,000 | -- | |
| Himes Elton | $25,000 | -- | |
| Willis Dol | $18,000 | -- | |
| Pevahouse William R | $14,900 | -- |
Source: Public Records
Mortgage History
| Date | Status | Borrower | Loan Amount |
|---|---|---|---|
| Open | Runions Paula | $58,200 |
Source: Public Records
Tax History Compared to Growth
Tax History
| Year | Tax Paid | Tax Assessment Tax Assessment Total Assessment is a certain percentage of the fair market value that is determined by local assessors to be the total taxable value of land and additions on the property. | Land | Improvement |
|---|---|---|---|---|
| 2025 | -- | $33,250 | $0 | $0 |
| 2024 | -- | $12,500 | $1,800 | $10,700 |
| 2023 | $376 | $12,500 | $1,800 | $10,700 |
| 2022 | $376 | $12,500 | $1,800 | $10,700 |
| 2021 | $376 | $12,500 | $1,800 | $10,700 |
| 2020 | $267 | $12,500 | $1,800 | $10,700 |
| 2019 | $316 | $8,675 | $1,375 | $7,300 |
| 2018 | $316 | $8,675 | $1,375 | $7,300 |
| 2017 | $329 | $8,675 | $1,375 | $7,300 |
| 2016 | $329 | $8,675 | $1,375 | $7,300 |
| 2015 | -- | $8,675 | $1,375 | $7,300 |
| 2014 | -- | $8,675 | $1,375 | $7,300 |
| 2013 | -- | $7,550 | $0 | $0 |
Source: Public Records
Map
Nearby Homes