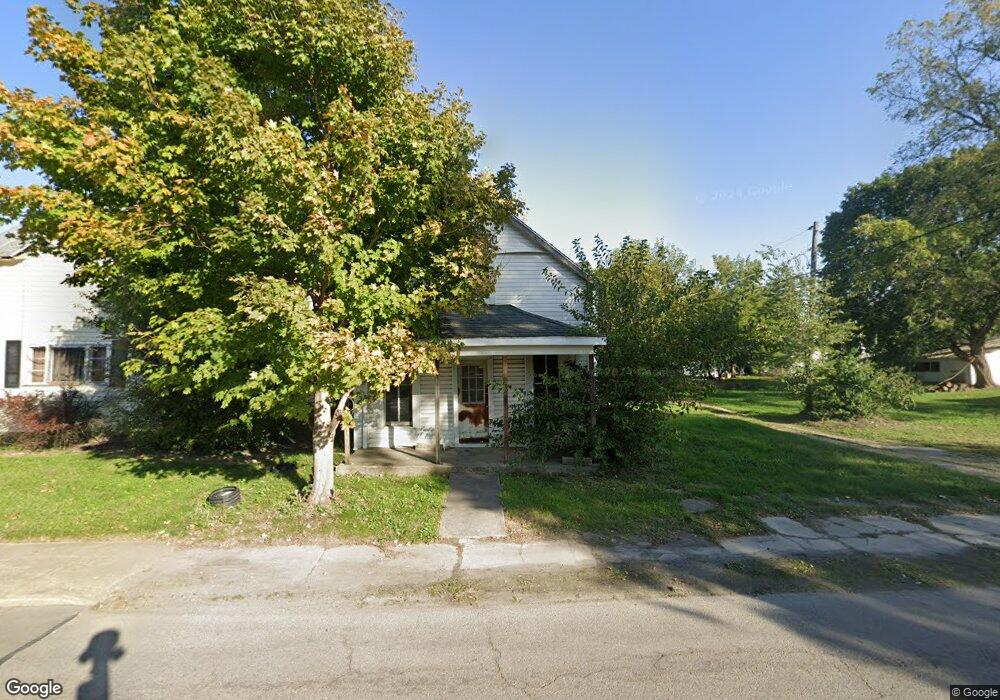
218 N State Line St Union City, OH 45390
Estimated Value: $64,496 - $130,000
4
Beds
1
Bath
1,405
Sq Ft
$71/Sq Ft
Est. Value
About This Home
This home is located at 218 N State Line St, Union City, OH 45390 and is currently estimated at $99,832, approximately $71 per square foot. 218 N State Line St is a home located in Darke County with nearby schools including Mississinawa Valley Elementary School and Mississinawa Valley Junior/Senior High School.
Ownership History
Date
Name
Owned For
Owner Type
Purchase Details
Closed on
Mar 19, 1999
Sold by
Hall Virginia
Bought by
Desmond R John
Current Estimated Value
Purchase Details
Closed on
Feb 1, 1990
Bought by
Desmond R John
Purchase Details
Closed on
Jul 1, 1987
Bought by
Desmond R John
Create a Home Valuation Report for This Property
The Home Valuation Report is an in-depth analysis detailing your home's value as well as a comparison with similar homes in the area
Home Values in the Area
Average Home Value in this Area
Purchase History
| Date | Buyer | Sale Price | Title Company |
|---|---|---|---|
| Desmond R John | $3,000 | -- | |
| Desmond R John | $4,000 | -- | |
| Desmond R John | $6,500 | -- |
Source: Public Records
Tax History Compared to Growth
Tax History
| Year | Tax Paid | Tax Assessment Tax Assessment Total Assessment is a certain percentage of the fair market value that is determined by local assessors to be the total taxable value of land and additions on the property. | Land | Improvement |
|---|---|---|---|---|
| 2024 | $58 | $1,700 | $1,340 | $360 |
| 2023 | $62 | $1,700 | $1,340 | $360 |
| 2022 | $57 | $1,390 | $1,120 | $270 |
| 2021 | $58 | $1,390 | $1,120 | $270 |
| 2020 | $58 | $1,390 | $1,120 | $270 |
| 2019 | $55 | $1,350 | $1,120 | $230 |
| 2018 | $63 | $1,350 | $1,120 | $230 |
| 2017 | $150 | $1,350 | $1,120 | $230 |
| 2016 | $150 | $3,500 | $1,490 | $2,010 |
| 2015 | $130 | $3,500 | $1,490 | $2,010 |
| 2014 | $130 | $3,500 | $1,490 | $2,010 |
| 2013 | $135 | $3,500 | $1,490 | $2,010 |
Source: Public Records
Map
Nearby Homes
- 504 N Union St
- 504 N Union St Unit Street
- 305 E North St
- 722 N Union St
- 617 N Columbia St
- 543 N Walnut St
- 507 N Howard St
- 612 N Howard St
- 230 NW Deerfield Rd
- 227 South St
- 207 Allen Dr
- 706 Lynwood Ct
- 508 N High St
- 718 Lynwood Ct
- 720 E Main St
- 103 S Wintergreen St
- 0 W Deerfield Rd Unit 23016117
- 0 W Deerfield Rd Unit 837795
- 0 W Deerfield Rd
- 800 W Chestnut St
- 224 N State Line St
- 107 E Oak St
- 101 E Oak St
- 109 E Oak St
- 217 N Cedar St
- 219 N Cedar St
- 13453 Ohio-Indian Line Rd
- 225 N Cedar St
- 117 E Oak St
- 307 N State Line St
- 304 N State Line St
- 215 N Cedar St
- 109 E North St
- 307 N State Line St
- 110 W Oak St
- 211 N Cedar St
- 120 W Oak St
- 113 E North St
- 311 N State Line St
- 117 E North St