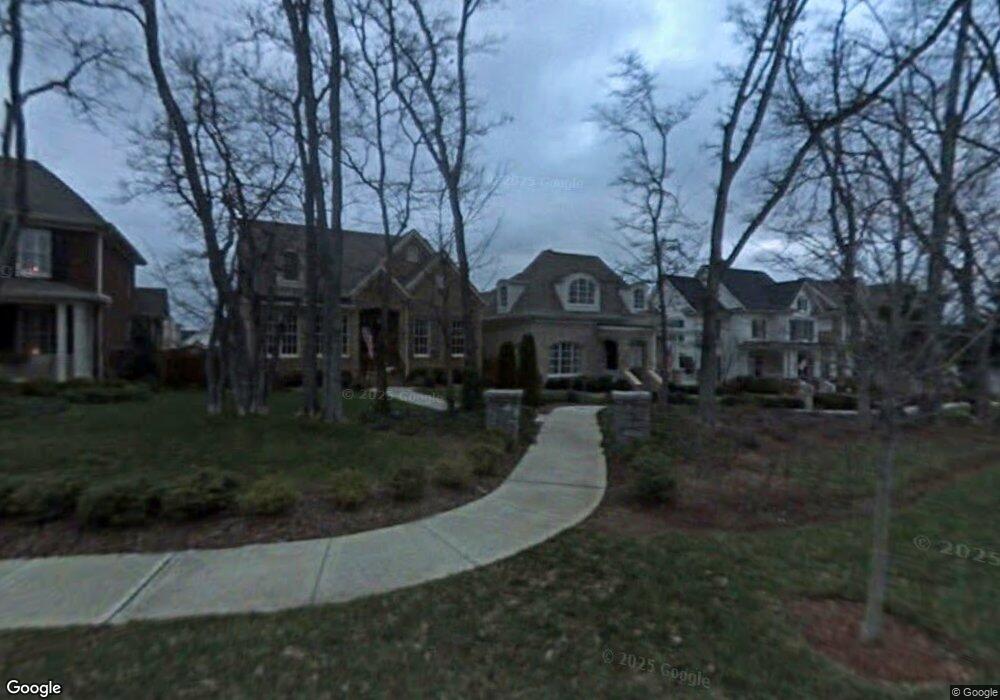
218 Prospect Ave Franklin, TN 37064
West Franklin NeighborhoodEstimated Value: $1,163,618 - $1,356,000
Studio
4
Baths
2,922
Sq Ft
$432/Sq Ft
Est. Value
About This Home
This home is located at 218 Prospect Ave, Franklin, TN 37064 and is currently estimated at $1,263,655, approximately $432 per square foot. 218 Prospect Ave is a home located in Williamson County with nearby schools including Pearre Creek Elementary School, New Hope Academy, and Franklin Christian Academy.
Ownership History
Date
Name
Owned For
Owner Type
Purchase Details
Closed on
Oct 18, 2024
Sold by
Herrington Pamela G
Bought by
Pamela Greer Herrington Living Trust and Herrington
Current Estimated Value
Purchase Details
Closed on
Jul 25, 2008
Sold by
Heatley James L and Heatley Sandra J
Bought by
Herrington Pamela G
Home Financials for this Owner
Home Financials are based on the most recent Mortgage that was taken out on this home.
Original Mortgage
$415,000
Interest Rate
6.27%
Mortgage Type
Purchase Money Mortgage
Purchase Details
Closed on
Sep 23, 2004
Sold by
Southern Land Co Llc
Bought by
Heatley James L and Heatley Sandra J
Purchase Details
Closed on
Dec 17, 2003
Sold by
Westhaven Partners Llc
Bought by
Southern Land Co Llc
Home Financials for this Owner
Home Financials are based on the most recent Mortgage that was taken out on this home.
Original Mortgage
$538,199
Interest Rate
5.87%
Mortgage Type
Construction
Create a Home Valuation Report for This Property
The Home Valuation Report is an in-depth analysis detailing your home's value as well as a comparison with similar homes in the area
Home Values in the Area
Average Home Value in this Area
Purchase History
| Date | Buyer | Sale Price | Title Company |
|---|---|---|---|
| Pamela Greer Herrington Living Trust | -- | None Listed On Document | |
| Pamela Greer Herrington Living Trust | -- | None Listed On Document | |
| Herrington Pamela G | $565,000 | Homeland Title Llc | |
| Heatley James L | $429,910 | Southland Title & Escrow Co | |
| Southern Land Co Llc | $538,199 | Southland Title & Escrow Co |
Source: Public Records
Mortgage History
| Date | Status | Borrower | Loan Amount |
|---|---|---|---|
| Previous Owner | Herrington Pamela G | $415,000 | |
| Previous Owner | Southern Land Co Llc | $538,199 |
Source: Public Records
Tax History
| Year | Tax Paid | Tax Assessment Tax Assessment Total Assessment is a certain percentage of the fair market value that is determined by local assessors to be the total taxable value of land and additions on the property. | Land | Improvement |
|---|---|---|---|---|
| 2025 | $3,391 | $265,900 | $60,000 | $205,900 |
| 2024 | $3,391 | $157,275 | $37,500 | $119,775 |
| 2023 | $3,391 | $157,275 | $37,500 | $119,775 |
| 2022 | $3,391 | $157,275 | $37,500 | $119,775 |
| 2021 | $3,391 | $157,275 | $37,500 | $119,775 |
| 2020 | $3,387 | $131,400 | $28,000 | $103,400 |
| 2019 | $3,387 | $131,400 | $28,000 | $103,400 |
| 2018 | $3,295 | $131,400 | $28,000 | $103,400 |
| 2017 | $3,269 | $131,400 | $28,000 | $103,400 |
| 2016 | $3,230 | $131,400 | $28,000 | $103,400 |
Source: Public Records
Map
Nearby Homes
- 205 Cheltenham Ave
- 209 Cheltenham Ave
- 406 Wild Elm St
- 121 Gladstone Ln
- 102 Pearl St
- 326 Starling Ln
- 206 Pearl St
- 226 Pearl St
- 1606 Championship Blvd
- 991 Westhaven Blvd Unit 13
- 1031 Westhaven Blvd
- 1184 Westhaven Blvd
- 611 Cheltenham Ave
- 604 Watermark Way
- 617 Cheltenham Ave
- 165 Front St
- 444 Wild Elm St
- 201 Acadia Ave
- 3013 Cleaver St
- 600 Pearre Springs Way
- 220 Prospect Ave
- 216 Prospect Ave
- 222 Prospect Ave
- 214 Prospect Ave
- 224 Prospect Ave
- 1303 State Blvd
- 1305 State Blvd
- 226 Prospect Ave
- 1301 State Blvd
- 1307 State Blvd
- 1207 State Blvd
- 228 Prospect Ave
- 225 Prospect Ave
- 223 Prospect Ave
- 1309 State Blvd
- 227 Prospect Ave
- 221 Prospect Ave
- 302 Addison Ave
- 304 Addison Ave
- 219 Prospect Ave
Your Personal Tour Guide
Ask me questions while you tour the home.