Estimated Value: $306,000 - $332,000
3
Beds
3
Baths
2,806
Sq Ft
$114/Sq Ft
Est. Value
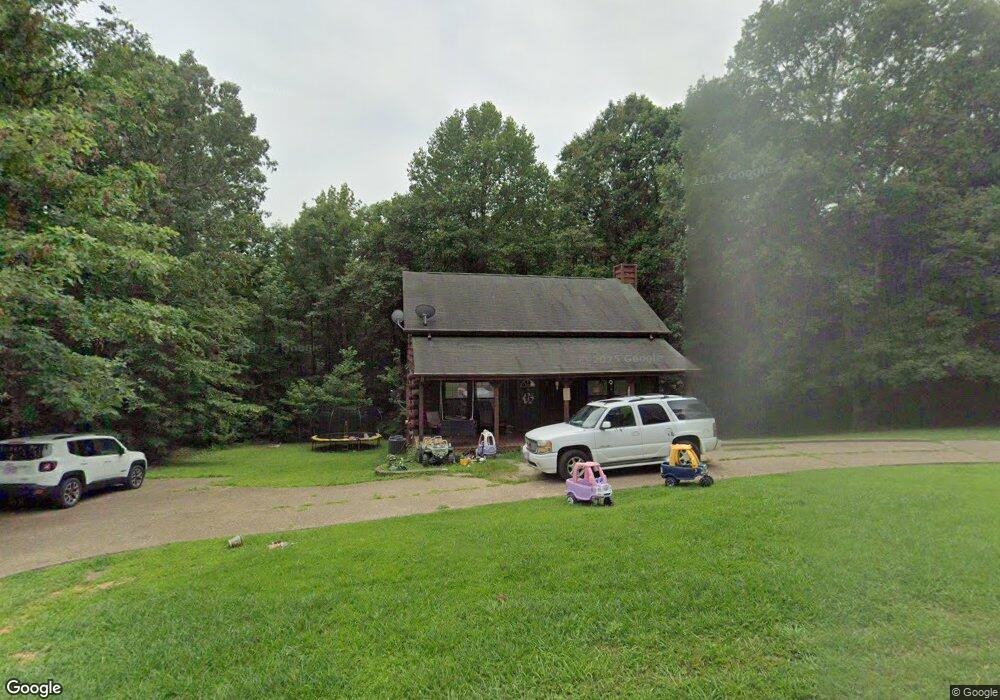
About This Home
This home is located at 218 Red Oak Rd, Dover, TN 37058 and is currently estimated at $320,315, approximately $114 per square foot. 218 Red Oak Rd is a home located in Stewart County with nearby schools including Dover Elementary School, Stewart County Middle School, and Stewart County High School.
Ownership History
Date
Name
Owned For
Owner Type
Purchase Details
Closed on
May 2, 2017
Sold by
Wallace Curtis
Bought by
Wallace Misty D
Current Estimated Value
Purchase Details
Closed on
Oct 30, 2012
Sold by
The Bank Of New York Mello
Bought by
Wallace Curtis
Purchase Details
Closed on
Feb 27, 2012
Sold by
Hoffman Christina
Bought by
The Bank Of New York Mellon and C/O Bac Tax Svcs Corp
Purchase Details
Closed on
Feb 12, 2012
Bought by
Bank Of New York Mellon
Purchase Details
Closed on
Dec 29, 2006
Sold by
Hall Thomas N
Bought by
Christina Hoffman
Home Financials for this Owner
Home Financials are based on the most recent Mortgage that was taken out on this home.
Original Mortgage
$137,600
Interest Rate
6.06%
Mortgage Type
Cash
Purchase Details
Closed on
Jul 29, 2004
Bought by
Hall Thomas N
Purchase Details
Closed on
Jun 28, 1999
Bought by
Marshall Timothy and Marshall Judith A
Purchase Details
Closed on
Aug 28, 1997
Bought by
Outlaw Frankie
Purchase Details
Closed on
Feb 3, 1995
Bought by
Cherry Don
Create a Home Valuation Report for This Property
The Home Valuation Report is an in-depth analysis detailing your home's value as well as a comparison with similar homes in the area
Home Values in the Area
Average Home Value in this Area
Purchase History
| Date | Buyer | Sale Price | Title Company |
|---|---|---|---|
| Wallace Misty D | -- | -- | |
| Wallace Curtis | $90,000 | -- | |
| The Bank Of New York Mellon | $164,573 | -- | |
| Bank Of New York Mellon | -- | -- | |
| Christina Hoffman | $172,000 | -- | |
| Hall Thomas N | $140,000 | -- | |
| Marshall Timothy | $110,000 | -- | |
| Outlaw Frankie | -- | -- | |
| Cherry Don | -- | -- |
Source: Public Records
Mortgage History
| Date | Status | Borrower | Loan Amount |
|---|---|---|---|
| Previous Owner | Cherry Don | $137,600 |
Source: Public Records
Tax History Compared to Growth
Tax History
| Year | Tax Paid | Tax Assessment Tax Assessment Total Assessment is a certain percentage of the fair market value that is determined by local assessors to be the total taxable value of land and additions on the property. | Land | Improvement |
|---|---|---|---|---|
| 2025 | $1,090 | $73,325 | $0 | $0 |
| 2024 | $1,090 | $73,325 | $4,325 | $69,000 |
| 2023 | $1,021 | $43,250 | $2,900 | $40,350 |
| 2022 | $1,021 | $43,250 | $2,900 | $40,350 |
| 2021 | $1,021 | $43,250 | $2,900 | $40,350 |
| 2020 | $1,053 | $43,250 | $2,900 | $40,350 |
| 2019 | $1,053 | $41,325 | $2,900 | $38,425 |
| 2018 | $1,053 | $41,325 | $2,900 | $38,425 |
| 2017 | $1,053 | $41,325 | $2,900 | $38,425 |
| 2016 | $1,053 | $41,325 | $2,900 | $38,425 |
| 2015 | $1,021 | $41,325 | $2,900 | $38,425 |
| 2014 | $1,061 | $41,325 | $2,900 | $38,425 |
| 2013 | $1,061 | $42,958 | $0 | $0 |
Source: Public Records
Map
Nearby Homes
- 183 Lockwood Hollow Rd
- 223 Twin Oaks Rd
- 0 Donelson Pkwy Unit 133998
- 0 Donelson Pkwy Unit RTC2818089
- 212 Skyline Ridge
- 1557 Donelson Pkwy Unit 1559
- 738 Keel Hollow Rd
- 0 Paradise Ln
- 222 Hickman Creek Rd
- 103 Thomas Rd
- 127 Lena Sykes Rd
- 0 Cox Hollow Rd Unit RTC3059643
- 0 Cox Hollow Rd Unit RTC3059513
- 0 Cox Hollow Rd Unit RTC3065500
- 0 Cox Hollow Rd Unit RTC3061585
- 0 Cox Hollow Rd Unit RTC3066737
- 0 Cox Hollow Rd Unit RTC3066735
- 0 Cox Hollow Rd Unit RTC3059512
- 0 Cox Hollow Rd Unit RTC3066732
- 0 Cox Hollow Rd Unit RTC3066733
- 230 Red Oak Rd
- 217 Red Oak Rd
- 109 Dead Wood Rd
- 231 Red Oak Rd
- 205 Red Oak Rd
- 179 Lockwood Hollow Rd
- 173 Lockwood Hollow Rd
- 187 Lockwood Hollow Rd
- 167 Lockwood Hollow Rd
- 200 Twin Oaks Rd
- 193 Lockwood Hollow Rd
- 108 Red Oak Rd
- 232 Twin Oaks Rd
- 115 Old State Route 76 Unit 115
- 147 Lockwood Hollow Rd
- 242 Twin Oaks Rd
- 233 Twin Oaks Rd
- 139 Lockwood Hollow Rd
- 250 Twin Oaks Rd
- 241 Twin Oaks Rd