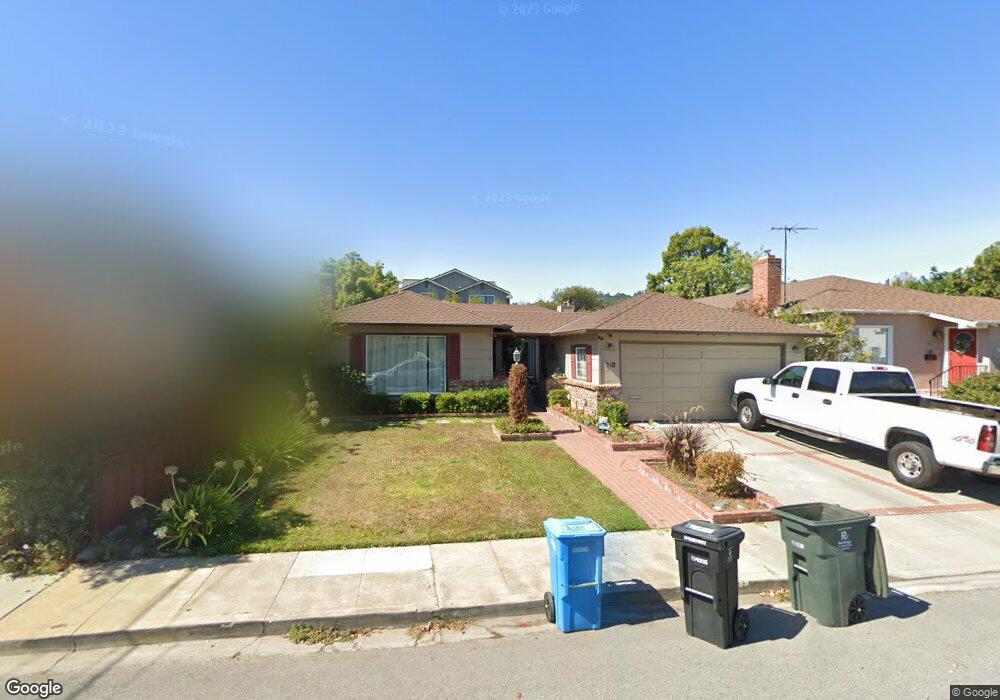
218 Ruby Ave San Carlos, CA 94070
El Sereno Corte NeighborhoodEstimated Value: $2,336,000 - $2,613,000
3
Beds
2
Baths
1,674
Sq Ft
$1,467/Sq Ft
Est. Value
About This Home
This home is located at 218 Ruby Ave, San Carlos, CA 94070 and is currently estimated at $2,455,757, approximately $1,466 per square foot. 218 Ruby Ave is a home located in San Mateo County with nearby schools including White Oaks Elementary School, Central Middle School, and Sequoia High School.
Ownership History
Date
Name
Owned For
Owner Type
Purchase Details
Closed on
Feb 6, 2003
Sold by
Franco Anne L
Bought by
Holm Sven Richard and Holm Bernita
Current Estimated Value
Home Financials for this Owner
Home Financials are based on the most recent Mortgage that was taken out on this home.
Original Mortgage
$150,000
Interest Rate
5.76%
Purchase Details
Closed on
Nov 13, 1997
Sold by
Franco Nicholas A
Bought by
Franco Anne L
Create a Home Valuation Report for This Property
The Home Valuation Report is an in-depth analysis detailing your home's value as well as a comparison with similar homes in the area
Home Values in the Area
Average Home Value in this Area
Purchase History
| Date | Buyer | Sale Price | Title Company |
|---|---|---|---|
| Holm Sven Richard | $765,000 | Fidelity National Title | |
| Franco Anne L | -- | -- |
Source: Public Records
Mortgage History
| Date | Status | Borrower | Loan Amount |
|---|---|---|---|
| Previous Owner | Holm Sven Richard | $150,000 |
Source: Public Records
Tax History
| Year | Tax Paid | Tax Assessment Tax Assessment Total Assessment is a certain percentage of the fair market value that is determined by local assessors to be the total taxable value of land and additions on the property. | Land | Improvement |
|---|---|---|---|---|
| 2025 | $13,097 | $1,054,322 | $499,701 | $554,621 |
| 2023 | $13,097 | $1,013,385 | $480,298 | $533,087 |
| 2022 | $12,310 | $993,516 | $470,881 | $522,635 |
| 2021 | $12,127 | $974,038 | $461,649 | $512,389 |
| 2020 | $11,985 | $964,052 | $456,916 | $507,136 |
| 2019 | $11,844 | $945,150 | $447,957 | $497,193 |
| 2018 | $11,525 | $926,619 | $439,174 | $487,445 |
| 2017 | $11,367 | $908,451 | $430,563 | $477,888 |
| 2016 | $11,120 | $890,640 | $422,121 | $468,519 |
| 2015 | $11,080 | $877,264 | $415,781 | $461,483 |
| 2014 | $10,798 | $860,081 | $407,637 | $452,444 |
Source: Public Records
Map
Nearby Homes
- 2349 Eaton Ave
- 2044 Saint Francis Way
- 2638 Eaton Ave
- 1235 Edgewood Rd
- 41 Maple Way
- 921 Arlington Rd
- 1353 Edgewood Rd
- 40 Robin Way
- 419 Hill Way
- 1365 Edgewood Rd
- 16 Hillview Ave
- 27 Nevada St
- 2308 Howard Ave
- 2780 Bromley Dr
- 1928 Howard Ave
- 2910 Sherwood Dr
- 6 El Sereno Dr
- 0 Cobblestone Ln
- 1388 Woodland Ave
- 1046 Lupin Way
- 212 Ruby Ave
- 224 Ruby Ave
- 232 Ruby Ave
- 525 Emerald Ave
- 533 Emerald Ave
- 517 Emerald Ave
- 2209 Saint Francis Way
- 2225 Saint Francis Way
- 541 Emerald Ave
- 238 Ruby Ave
- 2235 Saint Francis Way
- 221 Ruby Ave
- 215 Ruby Ave
- 229 Ruby Ave
- 549 Emerald Ave
- 2135 Saint Francis Way
- 2245 Saint Francis Way
- 233 Ruby Ave
- 244 Ruby Ave
- 239 Ruby Ave
Your Personal Tour Guide
Ask me questions while you tour the home.