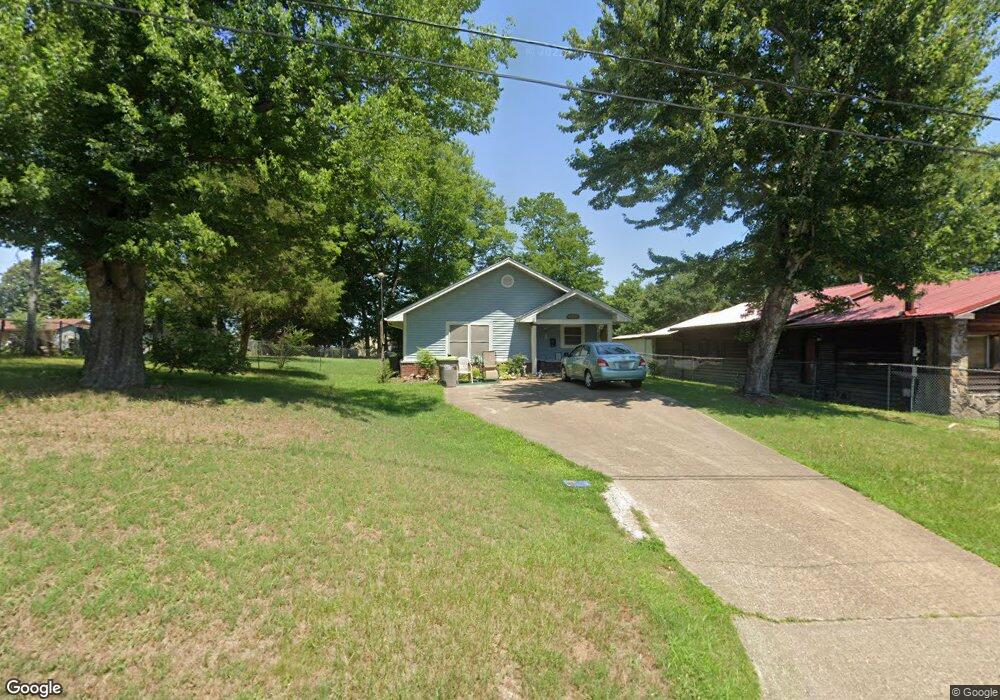
218 S 3rd St Benton, AR 72015
Estimated Value: $118,912 - $151,000
Studio
2
Baths
1,029
Sq Ft
$131/Sq Ft
Est. Value
About This Home
This home is located at 218 S 3rd St, Benton, AR 72015 and is currently estimated at $135,228, approximately $131 per square foot. 218 S 3rd St is a home located in Saline County with nearby schools including Angie Grant Elementary School, Benton Middle School, and Benton Junior High School.
Ownership History
Date
Name
Owned For
Owner Type
Purchase Details
Closed on
Oct 12, 2007
Sold by
Housing Authority Of The City
Bought by
Yarbrough Ethel L
Current Estimated Value
Home Financials for this Owner
Home Financials are based on the most recent Mortgage that was taken out on this home.
Original Mortgage
$55,627
Outstanding Balance
$35,199
Interest Rate
6.47%
Mortgage Type
FHA
Estimated Equity
$100,029
Purchase Details
Closed on
Aug 1, 1992
Bought by
Ha Of Cob
Purchase Details
Closed on
May 1, 1991
Bought by
Otts
Create a Home Valuation Report for This Property
The Home Valuation Report is an in-depth analysis detailing your home's value as well as a comparison with similar homes in the area
Home Values in the Area
Average Home Value in this Area
Purchase History
| Date | Buyer | Sale Price | Title Company |
|---|---|---|---|
| Yarbrough Ethel L | $57,000 | -- | |
| Ha Of Cob | $4,000 | -- | |
| Otts | -- | -- |
Source: Public Records
Mortgage History
| Date | Status | Borrower | Loan Amount |
|---|---|---|---|
| Open | Yarbrough Ethel L | $55,627 |
Source: Public Records
Tax History
| Year | Tax Paid | Tax Assessment Tax Assessment Total Assessment is a certain percentage of the fair market value that is determined by local assessors to be the total taxable value of land and additions on the property. | Land | Improvement |
|---|---|---|---|---|
| 2025 | $645 | $15,960 | $2,400 | $13,560 |
| 2024 | $661 | $15,960 | $2,400 | $13,560 |
| 2023 | $220 | $15,960 | $2,400 | $13,560 |
| 2022 | $270 | $15,960 | $2,400 | $13,560 |
| 2021 | $270 | $11,650 | $2,000 | $9,650 |
| 2020 | $270 | $11,650 | $2,000 | $9,650 |
| 2019 | $270 | $11,650 | $2,000 | $9,650 |
| 2018 | $294 | $11,650 | $2,000 | $9,650 |
| 2017 | $294 | $11,650 | $2,000 | $9,650 |
| 2016 | $666 | $11,740 | $2,000 | $9,740 |
| 2015 | $659 | $11,740 | $2,000 | $9,740 |
| 2014 | $309 | $11,740 | $2,000 | $9,740 |
Source: Public Records
Map
Nearby Homes
Your Personal Tour Guide
Ask me questions while you tour the home.