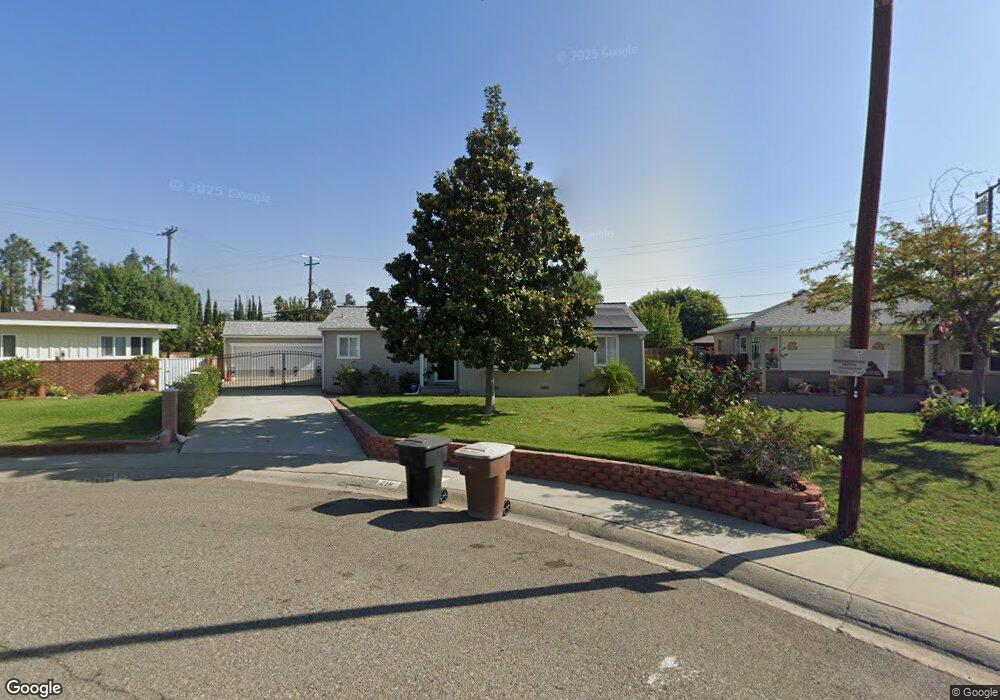
218 S Date St E Anaheim, CA 92805
North Anaheim NeighborhoodEstimated Value: $807,000 - $961,000
3
Beds
2
Baths
1,414
Sq Ft
$628/Sq Ft
Est. Value
About This Home
This home is located at 218 S Date St E, Anaheim, CA 92805 and is currently estimated at $888,302, approximately $628 per square foot. 218 S Date St E is a home located in Orange County with nearby schools including Abraham Lincoln Elementary School, Sycamore Junior High School, and Anaheim High School.
Ownership History
Date
Name
Owned For
Owner Type
Purchase Details
Closed on
Mar 25, 2011
Sold by
Cain Kevin
Bought by
Childress Allen Clarence
Current Estimated Value
Home Financials for this Owner
Home Financials are based on the most recent Mortgage that was taken out on this home.
Original Mortgage
$268,000
Outstanding Balance
$183,534
Interest Rate
4.72%
Mortgage Type
New Conventional
Estimated Equity
$704,768
Purchase Details
Closed on
Feb 18, 2003
Sold by
Cain Kevin
Bought by
Cain Kevin
Home Financials for this Owner
Home Financials are based on the most recent Mortgage that was taken out on this home.
Original Mortgage
$144,000
Interest Rate
5.93%
Purchase Details
Closed on
Mar 31, 1999
Sold by
Mae Nelson Eunice
Bought by
Cain Kevin
Home Financials for this Owner
Home Financials are based on the most recent Mortgage that was taken out on this home.
Original Mortgage
$146,000
Interest Rate
6.96%
Create a Home Valuation Report for This Property
The Home Valuation Report is an in-depth analysis detailing your home's value as well as a comparison with similar homes in the area
Home Values in the Area
Average Home Value in this Area
Purchase History
| Date | Buyer | Sale Price | Title Company |
|---|---|---|---|
| Childress Allen Clarence | $335,000 | Fidelity National Title | |
| Cain Kevin | -- | -- | |
| Cain Kevin | $182,500 | Fidelity National Title Ins |
Source: Public Records
Mortgage History
| Date | Status | Borrower | Loan Amount |
|---|---|---|---|
| Open | Childress Allen Clarence | $268,000 | |
| Previous Owner | Cain Kevin | $144,000 | |
| Previous Owner | Cain Kevin | $146,000 |
Source: Public Records
Tax History
| Year | Tax Paid | Tax Assessment Tax Assessment Total Assessment is a certain percentage of the fair market value that is determined by local assessors to be the total taxable value of land and additions on the property. | Land | Improvement |
|---|---|---|---|---|
| 2025 | $4,938 | $429,189 | $331,043 | $98,146 |
| 2024 | $4,938 | $420,774 | $324,552 | $96,222 |
| 2023 | $4,833 | $412,524 | $318,188 | $94,336 |
| 2022 | $4,770 | $404,436 | $311,949 | $92,487 |
| 2021 | $4,776 | $396,506 | $305,832 | $90,674 |
| 2020 | $4,756 | $392,441 | $302,696 | $89,745 |
| 2019 | $4,613 | $384,747 | $296,761 | $87,986 |
| 2018 | $4,517 | $377,203 | $290,942 | $86,261 |
| 2017 | $4,339 | $369,807 | $285,237 | $84,570 |
| 2016 | $4,325 | $362,556 | $279,644 | $82,912 |
| 2015 | $4,286 | $357,111 | $275,444 | $81,667 |
| 2014 | $4,021 | $350,116 | $270,048 | $80,068 |
Source: Public Records
Map
Nearby Homes
- 211 S Date St E
- 1617 E Lincoln Ave
- 225 N Coffman St
- 516 S State College Blvd
- 2113 E Westport Dr
- 2126 E Center St
- 537 S Priscilla Way
- 603 S Priscilla St
- 637 N Anna Dr
- 2321 E Puritan Ln
- 2420 E Agave St Unit 5
- 2420 E Agave St Unit 6
- 323 N Rose St Unit 6
- 2410 E Agave St Unit 3
- 421 N Rose St
- 629 S Kinney Way
- 518 N Rose St
- 820 E Santa Ana St
- 1150 N Brantford St
- 424 N East St
- 214 S Date St E
- 224 S Date St E
- 213 S Cliffrose St
- 219 S Cliffrose St
- 209 S Cliffrose St
- 223 S Cliffrose St
- 1718 E Lincoln Ave
- 228 S Date St E
- 1712 E Lincoln Ave
- 207 S Date St E
- 203 S Cliffrose St
- 223 S Date St E
- 229 S Cliffrose St
- 234 S Date St E
- 227 S Date St E
- 201 S Date St W
- 218 S Cliffrose St
- 238 S Date St E
- 235 S Cliffrose St
- 212 S Cliffrose St
Your Personal Tour Guide
Ask me questions while you tour the home.