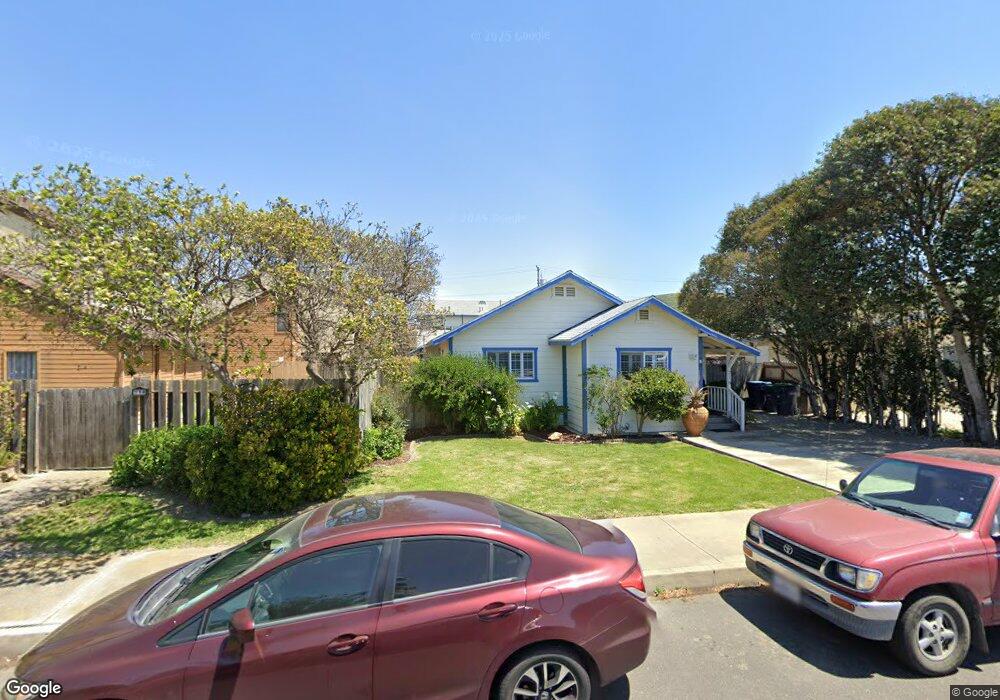
218 S F St Lompoc, CA 93436
Estimated Value: $665,000 - $891,401
6
Beds
4
Baths
3,029
Sq Ft
$260/Sq Ft
Est. Value
About This Home
This home is located at 218 S F St, Lompoc, CA 93436 and is currently estimated at $787,850, approximately $260 per square foot. 218 S F St is a home located in Santa Barbara County with nearby schools including Arthur Hapgood Elementary School, Lompoc Valley Middle School, and Lompoc High School.
Ownership History
Date
Name
Owned For
Owner Type
Purchase Details
Closed on
Aug 31, 2005
Sold by
Hoenigman John J and Hoenigman Suzanne R
Bought by
Walters Jeffrey S and Walters Deborah Bird
Current Estimated Value
Home Financials for this Owner
Home Financials are based on the most recent Mortgage that was taken out on this home.
Original Mortgage
$320,000
Interest Rate
1.37%
Mortgage Type
Negative Amortization
Purchase Details
Closed on
Jan 8, 2003
Sold by
Hoenigman John J and Hoenigman Mary A
Bought by
Hoenigman John J
Purchase Details
Closed on
Dec 17, 2002
Sold by
Hoenigman John J and Hoenigman Mary A
Bought by
Hoenigman John J
Purchase Details
Closed on
Nov 16, 1995
Sold by
Hoenigman John J and Hoenigman John J
Bought by
Hoenigman John J and Hoenigman John J
Create a Home Valuation Report for This Property
The Home Valuation Report is an in-depth analysis detailing your home's value as well as a comparison with similar homes in the area
Home Values in the Area
Average Home Value in this Area
Purchase History
| Date | Buyer | Sale Price | Title Company |
|---|---|---|---|
| Walters Jeffrey S | $400,000 | First American Title Company | |
| Hoenigman John J | -- | First American Title Company | |
| Hoenigman John J | -- | -- | |
| Hoenigman John J | -- | -- | |
| Hoenigman John J | -- | -- |
Source: Public Records
Mortgage History
| Date | Status | Borrower | Loan Amount |
|---|---|---|---|
| Previous Owner | Walters Jeffrey S | $320,000 |
Source: Public Records
Tax History Compared to Growth
Tax History
| Year | Tax Paid | Tax Assessment Tax Assessment Total Assessment is a certain percentage of the fair market value that is determined by local assessors to be the total taxable value of land and additions on the property. | Land | Improvement |
|---|---|---|---|---|
| 2025 | $8,136 | $780,000 | $231,000 | $549,000 |
| 2023 | $8,136 | $675,000 | $200,000 | $475,000 |
| 2022 | $7,556 | $675,000 | $200,000 | $475,000 |
| 2021 | $8,212 | $711,000 | $262,000 | $449,000 |
| 2020 | $7,454 | $646,000 | $238,000 | $408,000 |
| 2019 | $7,328 | $633,000 | $233,000 | $400,000 |
| 2018 | $7,008 | $603,000 | $222,000 | $381,000 |
| 2017 | $6,679 | $574,000 | $211,000 | $363,000 |
| 2016 | $6,079 | $522,000 | $192,000 | $330,000 |
| 2015 | $5,831 | $497,000 | $183,000 | $314,000 |
| 2014 | -- | $451,000 | $166,000 | $285,000 |
Source: Public Records
Map
Nearby Homes