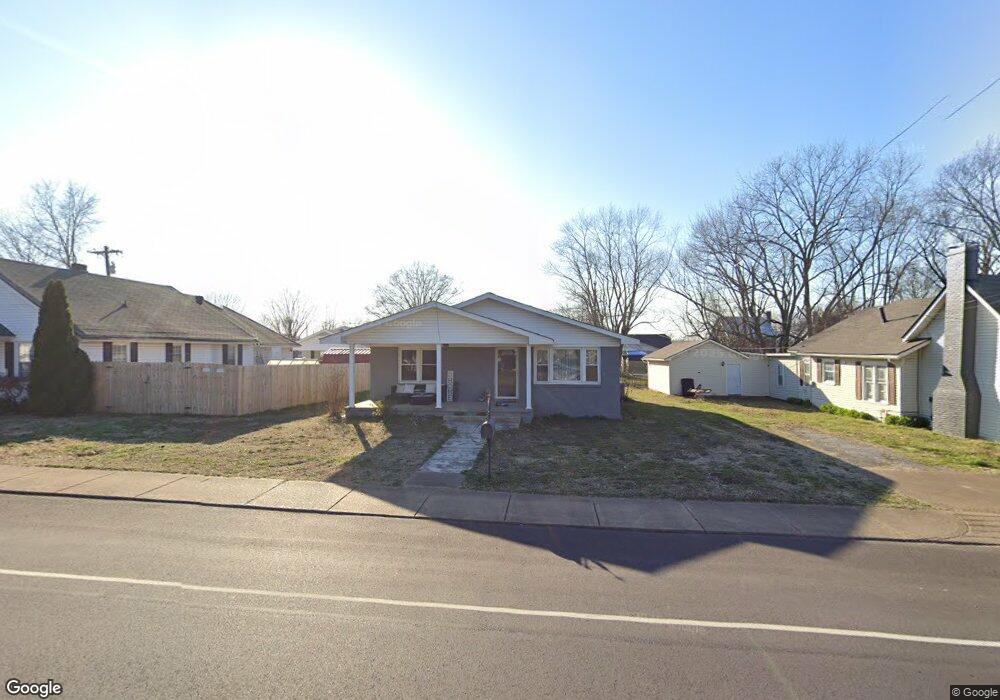
218 S Maple St Hohenwald, TN 38462
Estimated Value: $174,000 - $207,000
Studio
1
Bath
1,441
Sq Ft
$131/Sq Ft
Est. Value
About This Home
This home is located at 218 S Maple St, Hohenwald, TN 38462 and is currently estimated at $188,661, approximately $130 per square foot. 218 S Maple St is a home located in Lewis County with nearby schools including Lewis County Elementary School, Lewis County Intermediate School, and Lewis County Middle School.
Ownership History
Date
Name
Owned For
Owner Type
Purchase Details
Closed on
Mar 16, 2022
Sold by
Brewer Myles W
Bought by
Garrison Morgan D
Current Estimated Value
Home Financials for this Owner
Home Financials are based on the most recent Mortgage that was taken out on this home.
Original Mortgage
$128,282
Outstanding Balance
$119,545
Interest Rate
3.85%
Mortgage Type
New Conventional
Estimated Equity
$69,116
Purchase Details
Closed on
Apr 20, 2016
Sold by
Moore Brian Keith
Bought by
Brewer Myles W and Brewer Ashlyn B
Purchase Details
Closed on
Jan 19, 2009
Sold by
Moore Brian Keith
Bought by
Moore Brian Keith
Purchase Details
Closed on
Oct 23, 2006
Sold by
Mcright David R
Bought by
Moore Brian Keith
Home Financials for this Owner
Home Financials are based on the most recent Mortgage that was taken out on this home.
Original Mortgage
$51,750
Interest Rate
6.31%
Mortgage Type
Cash
Purchase Details
Closed on
Jan 14, 2004
Sold by
Anderson Mary Sue Estate
Bought by
Mcclain Michael G and Mcclain David R
Create a Home Valuation Report for This Property
The Home Valuation Report is an in-depth analysis detailing your home's value as well as a comparison with similar homes in the area
Home Values in the Area
Average Home Value in this Area
Purchase History
| Date | Buyer | Sale Price | Title Company |
|---|---|---|---|
| Garrison Morgan D | $127,000 | Assure Title | |
| Brewer Myles W | $63,500 | -- | |
| Moore Brian Keith | -- | -- | |
| Moore Brian Keith | $50,000 | -- | |
| Mcclain Michael G | $35,000 | -- |
Source: Public Records
Mortgage History
| Date | Status | Borrower | Loan Amount |
|---|---|---|---|
| Open | Garrison Morgan D | $128,282 | |
| Previous Owner | Mcclain Michael G | $51,750 |
Source: Public Records
Tax History
| Year | Tax Paid | Tax Assessment Tax Assessment Total Assessment is a certain percentage of the fair market value that is determined by local assessors to be the total taxable value of land and additions on the property. | Land | Improvement |
|---|---|---|---|---|
| 2025 | -- | $52,075 | $6,250 | $45,825 |
| 2024 | -- | $25,425 | $1,800 | $23,625 |
| 2023 | $766 | $25,425 | $1,800 | $23,625 |
| 2022 | $766 | $25,425 | $1,800 | $23,625 |
| 2021 | $766 | $25,425 | $1,800 | $23,625 |
| 2020 | $479 | $25,425 | $1,800 | $23,625 |
| 2019 | $561 | $15,375 | $1,625 | $13,750 |
| 2018 | $561 | $15,375 | $1,625 | $13,750 |
| 2017 | $584 | $15,375 | $1,625 | $13,750 |
| 2016 | $584 | $15,375 | $1,625 | $13,750 |
| 2015 | -- | $15,375 | $1,625 | $13,750 |
| 2014 | -- | $15,375 | $1,625 | $13,750 |
| 2013 | -- | $14,950 | $0 | $0 |
Source: Public Records
Map
Nearby Homes
- 17 E 3rd Ave
- 216 S Maple St
- 220 S Maple St
- 15 E 3rd Ave
- 212 S Maple St
- 213 S Park St
- 217 S Park St
- 302 S Maple St
- 211 S Park St
- 211 S Park St Unit B
- 211 S Park St Unit A
- 211A S Park St
- 211B S Park St
- 210 S Maple St
- 213 S Maple St
- 301 S Park St
- 208 S Maple St
- 211 S Maple St
- 217 S Maple St
- 209 S Park St
Your Personal Tour Guide
Ask me questions while you tour the home.