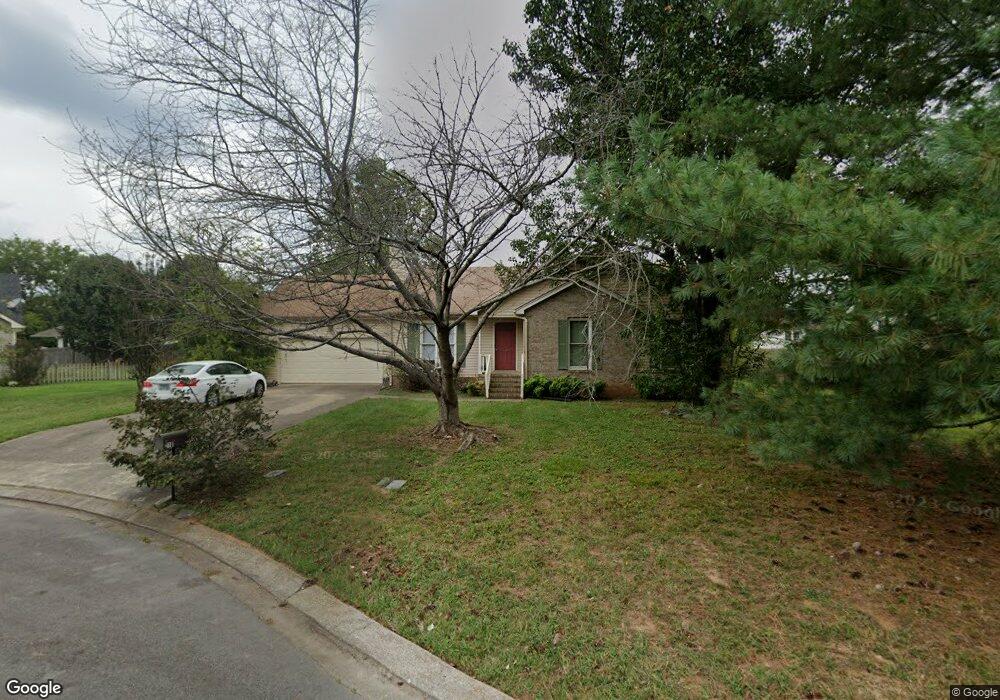
218 Turtle Rock Ct Murfreesboro, TN 37129
Estimated Value: $319,272 - $362,000
Studio
2
Baths
1,388
Sq Ft
$250/Sq Ft
Est. Value
About This Home
This home is located at 218 Turtle Rock Ct, Murfreesboro, TN 37129 and is currently estimated at $346,568, approximately $249 per square foot. 218 Turtle Rock Ct is a home located in Rutherford County with nearby schools including Erma Siegel Elementary School, Walter Hill Elementary School, and Siegel Middle School.
Ownership History
Date
Name
Owned For
Owner Type
Purchase Details
Closed on
Dec 6, 2018
Sold by
Brazelton Francys M
Bought by
Vaught Stan
Current Estimated Value
Home Financials for this Owner
Home Financials are based on the most recent Mortgage that was taken out on this home.
Original Mortgage
$104,221
Outstanding Balance
$91,821
Interest Rate
4.8%
Mortgage Type
Commercial
Estimated Equity
$254,747
Purchase Details
Closed on
Sep 20, 2007
Sold by
Arlydoob Inc
Bought by
Francys Brazelton
Home Financials for this Owner
Home Financials are based on the most recent Mortgage that was taken out on this home.
Original Mortgage
$142,980
Interest Rate
6.49%
Purchase Details
Closed on
Dec 9, 2005
Sold by
Divincenzo John P
Bought by
Arlydoob Inc
Home Financials for this Owner
Home Financials are based on the most recent Mortgage that was taken out on this home.
Original Mortgage
$113,850
Interest Rate
6.29%
Purchase Details
Closed on
Mar 14, 1997
Sold by
Brandon James M
Bought by
Divincenzo John P and Divincenzo Brenda
Create a Home Valuation Report for This Property
The Home Valuation Report is an in-depth analysis detailing your home's value as well as a comparison with similar homes in the area
Home Values in the Area
Average Home Value in this Area
Purchase History
| Date | Buyer | Sale Price | Title Company |
|---|---|---|---|
| Vaught Stan | $185,000 | Lawyers Land & Title Svcs Ll | |
| Francys Brazelton | $142,500 | -- | |
| Arlydoob Inc | $126,500 | -- | |
| Divincenzo John P | $92,000 | -- |
Source: Public Records
Mortgage History
| Date | Status | Borrower | Loan Amount |
|---|---|---|---|
| Open | Vaught Stan | $104,221 | |
| Previous Owner | Divincenzo John P | $142,980 | |
| Previous Owner | Divincenzo John P | $113,850 |
Source: Public Records
Tax History
| Year | Tax Paid | Tax Assessment Tax Assessment Total Assessment is a certain percentage of the fair market value that is determined by local assessors to be the total taxable value of land and additions on the property. | Land | Improvement |
|---|---|---|---|---|
| 2025 | $1,998 | $70,625 | $13,750 | $56,875 |
| 2024 | $1,325 | $70,625 | $13,750 | $56,875 |
| 2023 | $1,325 | $70,625 | $13,750 | $56,875 |
| 2022 | $1,141 | $70,625 | $13,750 | $56,875 |
| 2021 | $1,068 | $48,100 | $9,375 | $38,725 |
| 2020 | $1,068 | $48,100 | $9,375 | $38,725 |
| 2019 | $1,068 | $48,100 | $9,375 | $38,725 |
| 2018 | $1,625 | $53,300 | $0 | $0 |
| 2017 | $1,462 | $37,600 | $0 | $0 |
| 2016 | $1,462 | $37,600 | $0 | $0 |
| 2015 | $1,462 | $37,600 | $0 | $0 |
| 2014 | $819 | $37,600 | $0 | $0 |
| 2013 | -- | $33,950 | $0 | $0 |
Source: Public Records
Map
Nearby Homes
- 3502 Winterfell Dr
- 0 Thompson Rd Unit RTC3050461
- 0 Thompson Rd Unit RTC3030765
- 618 Palisade Dr
- 507 Kings Ridge Dr
- 3436 Caroline Farms Dr
- 3444 Caroline Farms Dr
- 3534 Caroline Farms Dr
- 3524 Magruder Dr
- 3710 Caroline Farms Dr
- 3429 John Richards Dr
- 3425 John Richards Dr
- 3419 John Richards Dr
- 3435 John Richards Dr
- 3431 John Richards Dr
- 3505 John Richards Dr
- 3417 John Richards Dr
- 3411 John Richards Dr
- 413 Spotted Saddle Ct
- 3508 Pershing Dr
- 214 Turtle Rock Ct
- 219 Cobblefield Ave
- 222 Turtle Rock Ct
- 223 Cobblefield Ave
- 215 Cobblefield Ave
- 210 Turtle Rock Ct
- 225 Turtle Rock Ct
- 217 Turtle Rock Ct
- 227 Cobblefield Ave
- 213 Turtle Rock Ct
- 211 Cobblefield Ave
- 221 Turtle Rock Ct
- 206 Turtle Rock Ct
- 209 Turtle Rock Ct
- 207 Cobblefield Ave
- 220 Cobblefield Ave
- 224 Cobblefield Ave
- 205 Turtle Rock Ct
- 216 Cobblefield Ave
- 236 W Thompson Ln
Your Personal Tour Guide
Ask me questions while you tour the home.