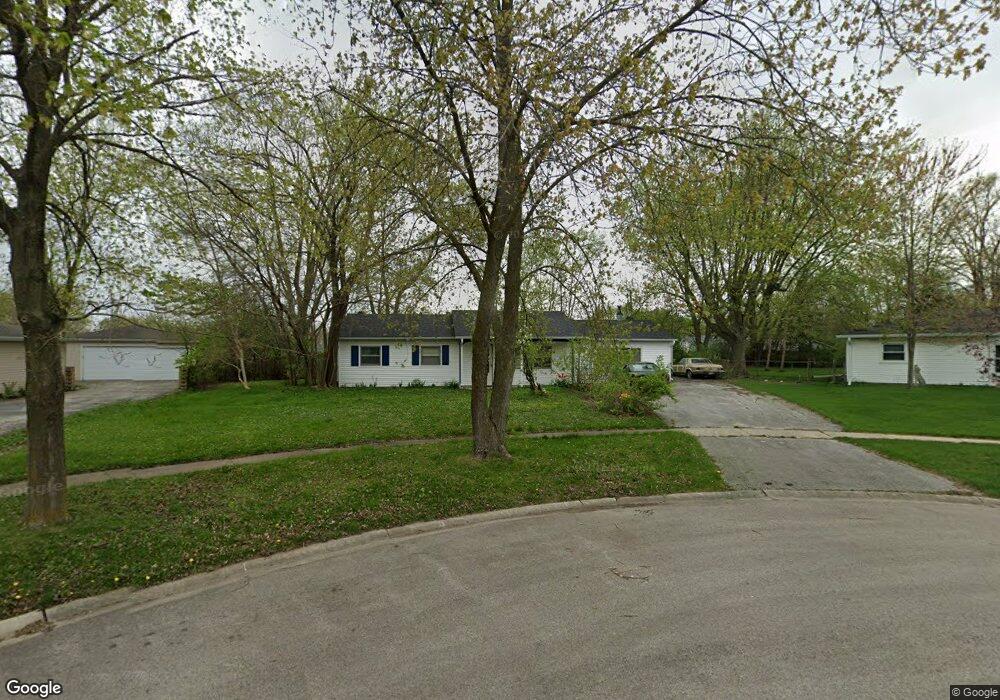
218 W Arrowhead St Unit 3 North Aurora, IL 60542
Estimated Value: $283,000 - $328,000
3
Beds
--
Bath
1,480
Sq Ft
$207/Sq Ft
Est. Value
About This Home
This home is located at 218 W Arrowhead St Unit 3, North Aurora, IL 60542 and is currently estimated at $306,479, approximately $207 per square foot. 218 W Arrowhead St Unit 3 is a home located in Kane County with nearby schools including Schneider Elementary School, Herget Middle School, and West Aurora High School.
Ownership History
Date
Name
Owned For
Owner Type
Purchase Details
Closed on
Oct 23, 2000
Sold by
Erb Joseph P
Bought by
Erb Joseph P and Erb Terina L
Current Estimated Value
Purchase Details
Closed on
May 19, 2000
Sold by
Tcf National Bank
Bought by
Erb Joseph P
Home Financials for this Owner
Home Financials are based on the most recent Mortgage that was taken out on this home.
Original Mortgage
$88,000
Outstanding Balance
$31,321
Interest Rate
8.56%
Estimated Equity
$275,158
Purchase Details
Closed on
Mar 1, 2000
Sold by
Butz Bill R
Bought by
Tcf National Bank Minnesota
Purchase Details
Closed on
Dec 31, 1996
Sold by
Butz Lynda M
Bought by
Butz Bill R
Home Financials for this Owner
Home Financials are based on the most recent Mortgage that was taken out on this home.
Original Mortgage
$94,961
Interest Rate
7.74%
Create a Home Valuation Report for This Property
The Home Valuation Report is an in-depth analysis detailing your home's value as well as a comparison with similar homes in the area
Home Values in the Area
Average Home Value in this Area
Purchase History
| Date | Buyer | Sale Price | Title Company |
|---|---|---|---|
| Erb Joseph P | -- | -- | |
| Erb Joseph P | $93,000 | Attorneys Title Guaranty Fun | |
| Tcf National Bank Minnesota | -- | -- | |
| Butz Bill R | -- | -- |
Source: Public Records
Mortgage History
| Date | Status | Borrower | Loan Amount |
|---|---|---|---|
| Open | Erb Joseph P | $88,000 | |
| Previous Owner | Butz Bill R | $94,961 |
Source: Public Records
Tax History
| Year | Tax Paid | Tax Assessment Tax Assessment Total Assessment is a certain percentage of the fair market value that is determined by local assessors to be the total taxable value of land and additions on the property. | Land | Improvement |
|---|---|---|---|---|
| 2024 | $6,167 | $90,036 | $16,735 | $73,301 |
| 2023 | $5,998 | $81,717 | $15,189 | $66,528 |
| 2022 | $5,145 | $68,261 | $14,195 | $54,066 |
| 2021 | $4,994 | $64,740 | $13,463 | $51,277 |
| 2020 | $4,973 | $63,495 | $13,204 | $50,291 |
| 2019 | $5,022 | $61,248 | $12,737 | $48,511 |
| 2018 | $4,974 | $58,915 | $12,252 | $46,663 |
| 2017 | $4,932 | $56,972 | $11,848 | $45,124 |
| 2016 | $4,917 | $55,313 | $11,503 | $43,810 |
| 2015 | -- | $54,053 | $11,241 | $42,812 |
| 2014 | -- | $52,351 | $10,887 | $41,464 |
| 2013 | -- | $54,888 | $14,233 | $40,655 |
Source: Public Records
Map
Nearby Homes
- 318 Dee Rd
- 210 Linn Ct Unit D
- 200 Linn Ct Unit C
- 320 Sussex Ln
- 407 Butterfield Rd
- 242 Sussex Ln
- 218 Sussex Ct
- 313 Carrie Ct
- 306 Carrie Ct
- 906 Homerton Blvd
- 28 Oak Creek Ct
- 10 S Grant St
- 63 Oak Creek Ct
- 243 Durham St
- 239 Durham St
- 10 N Adams St
- 346 Timber Oaks Dr
- 344 Timber Oaks Dr
- 2S924 Shagbark Dr
- 307 Hill Ave
- 216 W Arrowhead St
- 220 W Arrowhead St
- 221B Laurel Dr
- 219 Laurel Dr Unit B
- 219A Laurel Dr
- 221A Laurel Dr Unit A
- 221 Laurel Dr Unit A
- 221 Laurel Dr Unit B
- 223B Laurel Dr
- 217A Laurel Dr Unit B
- 217 Laurel Dr Unit A
- 214 W Arrowhead St
- 223A Laurel Dr
- 307 N Arrowhead St
- 225 Laurel Dr Unit B
- 225 Laurel Dr Unit A
- 215A Laurel Dr Unit B
- 215 Laurel Dr Unit 1
- 212 W Arrowhead St Unit 4
- 310 N Arrowhead St Unit 3
Your Personal Tour Guide
Ask me questions while you tour the home.