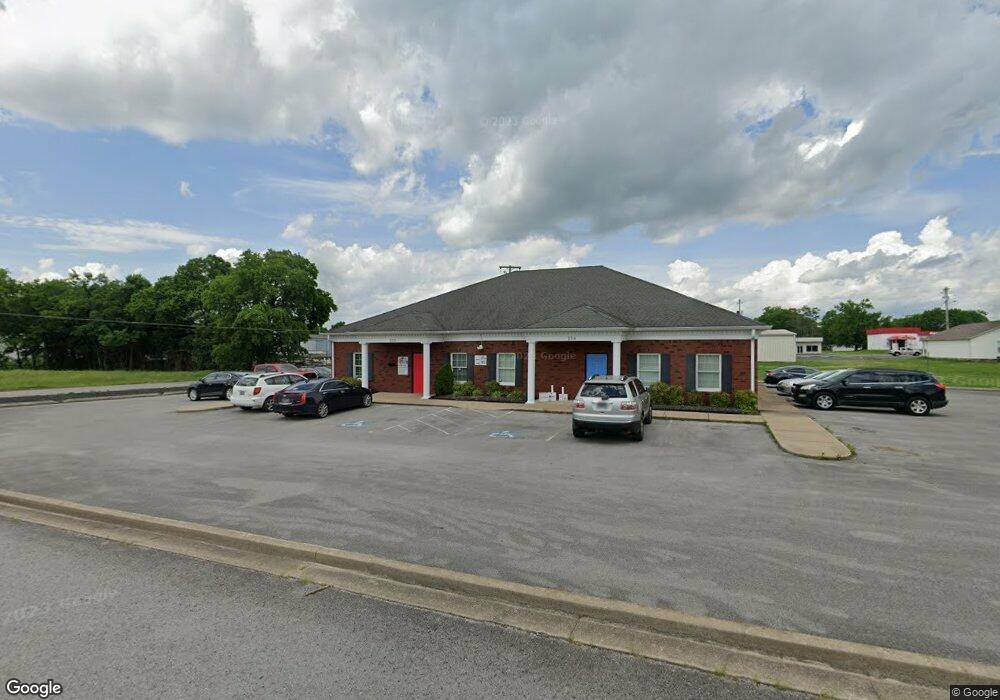
218 W Cedar St Shelbyville, TN 37160
Estimated Value: $937,000
--
Bed
3
Baths
3,436
Sq Ft
$273/Sq Ft
Est. Value
About This Home
This home is located at 218 W Cedar St, Shelbyville, TN 37160 and is currently priced at $937,000, approximately $272 per square foot. 218 W Cedar St is a home located in Bedford County with nearby schools including Eakin Elementary School, Harris Middle School, and Victory Baptist Academy.
Ownership History
Date
Name
Owned For
Owner Type
Purchase Details
Closed on
Jun 25, 2019
Sold by
Tamula George Gerard Z and Tamula Alma M
Bought by
Loleh Samer
Current Estimated Value
Home Financials for this Owner
Home Financials are based on the most recent Mortgage that was taken out on this home.
Original Mortgage
$40,000
Outstanding Balance
$35,098
Interest Rate
4%
Mortgage Type
New Conventional
Purchase Details
Closed on
Mar 3, 2003
Sold by
King Garland and King Ruth
Bought by
Jones James T
Home Financials for this Owner
Home Financials are based on the most recent Mortgage that was taken out on this home.
Original Mortgage
$60,999
Interest Rate
5.88%
Mortgage Type
Commercial
Purchase Details
Closed on
Apr 29, 1998
Sold by
Winton Calvin
Bought by
King Garland and King Ruth
Purchase Details
Closed on
May 11, 1993
Bought by
Winton Calvin
Purchase Details
Closed on
Nov 6, 1990
Bought by
Winton Calvin and Olene Marie
Purchase Details
Closed on
Mar 9, 1977
Bought by
Tune John L and Tune Edwina S
Create a Home Valuation Report for This Property
The Home Valuation Report is an in-depth analysis detailing your home's value as well as a comparison with similar homes in the area
Home Values in the Area
Average Home Value in this Area
Purchase History
| Date | Buyer | Sale Price | Title Company |
|---|---|---|---|
| Loleh Samer | $380,000 | None Available | |
| Jones James T | $75,000 | -- | |
| King Garland | $10,700 | -- | |
| Winton Calvin | -- | -- | |
| Winton Calvin | $22,000 | -- | |
| Tune John L | -- | -- |
Source: Public Records
Mortgage History
| Date | Status | Borrower | Loan Amount |
|---|---|---|---|
| Open | Loleh Samer | $40,000 | |
| Previous Owner | Tune John L | $60,999 |
Source: Public Records
Tax History Compared to Growth
Tax History
| Year | Tax Paid | Tax Assessment Tax Assessment Total Assessment is a certain percentage of the fair market value that is determined by local assessors to be the total taxable value of land and additions on the property. | Land | Improvement |
|---|---|---|---|---|
| 2025 | -- | $170,240 | $0 | $0 |
| 2024 | -- | $170,240 | $16,200 | $154,040 |
| 2023 | $6,478 | $170,240 | $16,200 | $154,040 |
| 2022 | $6,665 | $170,240 | $16,200 | $154,040 |
| 2021 | $6,053 | $170,240 | $16,200 | $154,040 |
| 2020 | $7,621 | $170,240 | $16,200 | $154,040 |
| 2019 | $7,621 | $172,040 | $18,840 | $153,200 |
| 2018 | $7,449 | $172,040 | $18,840 | $153,200 |
| 2017 | $7,449 | $172,040 | $18,840 | $153,200 |
| 2016 | $7,380 | $172,040 | $18,840 | $153,200 |
| 2015 | $7,381 | $172,040 | $18,840 | $153,200 |
| 2014 | $5,495 | $140,183 | $0 | $0 |
Source: Public Records
Map
Nearby Homes
- 112 E Cedar St
- 0 Hilltop Rd Unit RTC2897754
- 0 Hilltop Rd Unit RTC3001632
- 102 Saddlewood Dr
- 703 Deery St
- 312 Cottonwood Dr
- 1017 Fairfield Pike
- 115 Scotland Heights
- 636 Deery St
- 129 Annas Way
- 130 Horseshoe Dr
- 724 Alton Ave
- 0 Archery Ln
- 134 Butler St
- 527 Deery St
- 713 King Ave
- 714 King Ave
- 114 Collier Ave
- 178 Lucas Rd
- 610 Sundance St
- 220 W Cedar St
- 804 Sevier St
- 809 Sevier St
- 807 Sevier St
- 200 W Cedar St
- 805 Sevier St
- 802 Sevier St
- 800 Sevier St
- 0 Sevier St Unit RTC2039330
- 0 Sevier St Unit RTC2107616
- 0 Sevier St Unit RTC2267174
- 0 Sevier St
- 803 Lipscomb St
- 736 Sevier St
- 207 W Highland Ave
- 205 W Highland Ave
- 734 Sevier St
- 804 Lipscomb St
- 203 W Highland Ave
- 773 Lipscomb St