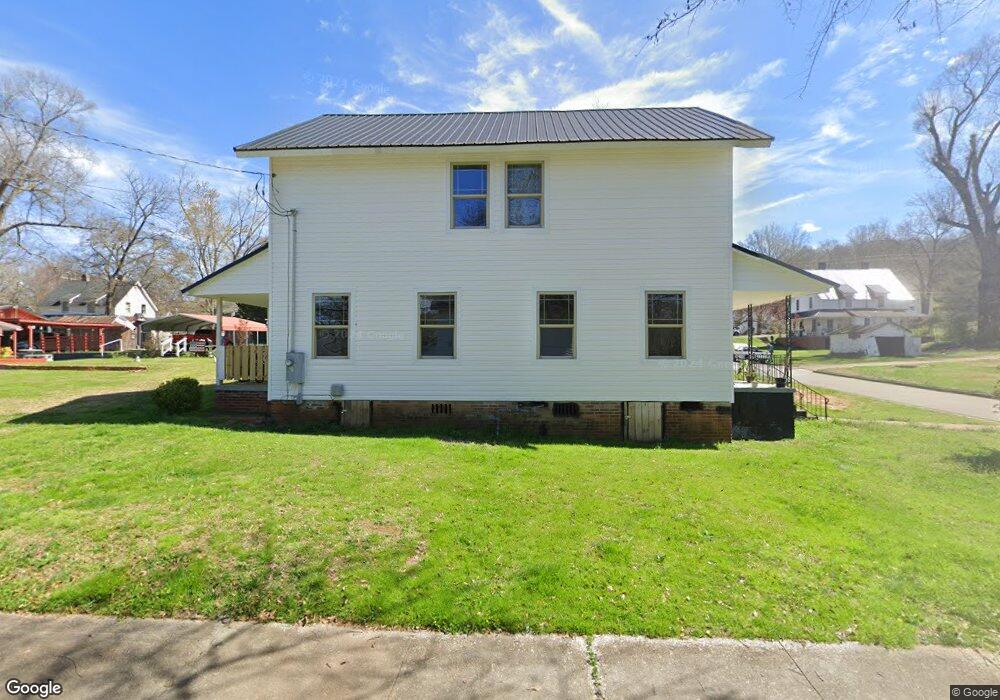
218 Walnut Ave SE Lindale, GA 30147
Estimated Value: $62,000 - $83,900
6
Beds
2
Baths
2,346
Sq Ft
$31/Sq Ft
Est. Value
About This Home
This home is located at 218 Walnut Ave SE, Lindale, GA 30147 and is currently estimated at $71,975, approximately $30 per square foot. 218 Walnut Ave SE is a home located in Floyd County with nearby schools including Pepperell Middle School, Pepperell High School, and Montessori School of Rome.
Ownership History
Date
Name
Owned For
Owner Type
Purchase Details
Closed on
Mar 16, 2022
Sold by
Fincher Richard
Bought by
Hann Johnny Wayne
Current Estimated Value
Purchase Details
Closed on
Dec 19, 2014
Sold by
Pilot Financial Llc
Bought by
Zapata Mary Luz
Purchase Details
Closed on
Jan 26, 2010
Sold by
Beaver Mary Diane and Beaver Brian K
Bought by
Pilot Financial Llc
Purchase Details
Closed on
Dec 28, 1999
Sold by
Wooten Joann W and Winters Gene W
Bought by
Beaver Mary Diane and Pauline Lumpkin
Purchase Details
Closed on
Jun 28, 1993
Sold by
Winters Gene W
Bought by
Wooten Joann W and Winters Gene W
Purchase Details
Closed on
Apr 28, 1988
Sold by
Winters Mrs Ruth
Bought by
Winters Gene W and Wooten Joann W
Purchase Details
Closed on
Jul 9, 1968
Sold by
Garrett M M
Bought by
Winters Mrs Ruth
Purchase Details
Closed on
Jan 1, 1950
Sold by
Garrett Mm
Bought by
Garrett M M
Purchase Details
Closed on
Jan 1, 1901
Bought by
Garrett Mm
Create a Home Valuation Report for This Property
The Home Valuation Report is an in-depth analysis detailing your home's value as well as a comparison with similar homes in the area
Home Values in the Area
Average Home Value in this Area
Purchase History
| Date | Buyer | Sale Price | Title Company |
|---|---|---|---|
| Hann Johnny Wayne | $50,000 | -- | |
| Zapata Mary Luz | $14,000 | -- | |
| Pilot Financial Llc | $8,000 | -- | |
| Beaver Mary Diane | -- | -- | |
| Wooten Joann W | -- | -- | |
| Winters Gene W | $30,000 | -- | |
| Wooten Joann W | $15,000 | -- | |
| Winters Mrs Ruth | $7,500 | -- | |
| Garrett M M | -- | -- | |
| Garrett Mm | -- | -- |
Source: Public Records
Tax History
| Year | Tax Paid | Tax Assessment Tax Assessment Total Assessment is a certain percentage of the fair market value that is determined by local assessors to be the total taxable value of land and additions on the property. | Land | Improvement |
|---|---|---|---|---|
| 2025 | $2,327 | $79,142 | $8,357 | $70,785 |
| 2024 | $2,327 | $25,554 | $7,597 | $17,957 |
| 2023 | $792 | $24,132 | $6,906 | $17,226 |
| 2022 | $642 | $19,556 | $5,525 | $14,031 |
| 2021 | $505 | $14,762 | $5,525 | $9,237 |
| 2020 | $446 | $12,805 | $4,144 | $8,661 |
| 2019 | $383 | $13,286 | $4,144 | $9,142 |
| 2018 | $428 | $12,548 | $4,144 | $8,404 |
| 2017 | $417 | $12,157 | $4,144 | $8,013 |
| 2016 | $487 | $14,276 | $4,120 | $10,156 |
| 2015 | $486 | $14,276 | $4,120 | $10,156 |
| 2014 | $486 | $14,511 | $4,120 | $10,391 |
Source: Public Records
Map
Nearby Homes
- 311 Park Ave SE
- 305 Grove Ave SE
- 10 N Hillcrest Dr SE
- 6 Hillside Ave SE
- 13 N Terrace Ave SE
- 17 N Terrace Ave SE
- 0 2nd St- Lindale Ave
- 1491 Booze Mountain Rd SE
- 220 Avenue D SE
- 791 Park Ave SE
- 0 Edenfield Dr SE Unit 21222627
- 1572 Booze Mountain Rd SE
- 302 Jack St
- 169 Jack St SE
- 27 Hughes Dairy Rd SE
- 19 Silver Hills Rd SE
- 106 Sunset Dr SE
- 16 Club View Dr SE
- 16 Summit Dr SE
- 211 Sunset Dr SE
- 218 Walnut Ave SE Unit 220
- 220 Walnut Ave SE
- 214 Walnut Ave SE
- 219 Walnut Ave
- 217 Walnut Ave SE
- 302 Walnut Ave SE
- 0 Walnut Ave
- 213 Walnut Ave SE
- 217 Park Ave SE
- 301 Walnut Ave SE Unit 303
- 215 Park Ave SE
- 301 Park Ave SE
- 210 Walnut Ave SE
- 306 Walnut Ave SE
- 209 Walnut Ave SE
- 305 Walnut Ave SE
- 209 Park Ave SE Unit 121
- 209 Park Ave SE
- 214 Garden Ave SE
- 305 Park Ave SE
Your Personal Tour Guide
Ask me questions while you tour the home.