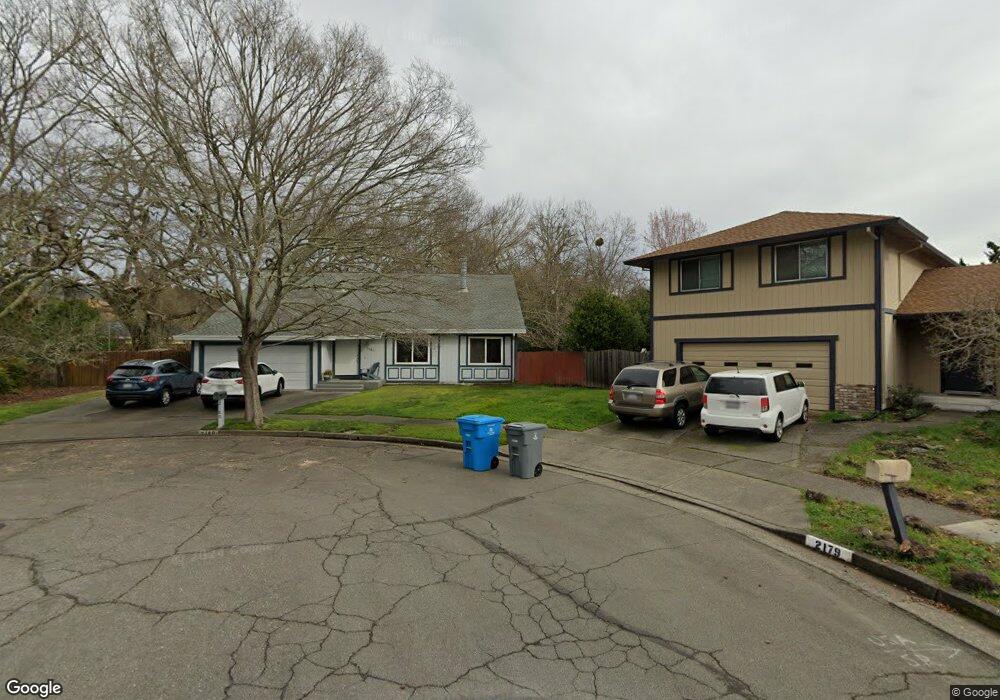
2180 Alejandro Dr Santa Rosa, CA 95405
Montgomery Village NeighborhoodEstimated Value: $717,000 - $1,022,000
4
Beds
3
Baths
2,159
Sq Ft
$422/Sq Ft
Est. Value
About This Home
This home is located at 2180 Alejandro Dr, Santa Rosa, CA 95405 and is currently estimated at $911,437, approximately $422 per square foot. 2180 Alejandro Dr is a home located in Sonoma County with nearby schools including Strawberry Elementary School, Yulupa Elementary School, and Herbert Slater Middle School.
Ownership History
Date
Name
Owned For
Owner Type
Purchase Details
Closed on
May 6, 2009
Sold by
Cox Jeffrey K
Bought by
Cox Jeffrey K
Current Estimated Value
Home Financials for this Owner
Home Financials are based on the most recent Mortgage that was taken out on this home.
Original Mortgage
$298,000
Outstanding Balance
$187,776
Interest Rate
4.8%
Mortgage Type
New Conventional
Estimated Equity
$723,661
Purchase Details
Closed on
Oct 27, 2008
Sold by
Cox Julia Marie and Cox Jeffrey K
Bought by
Cox Jeffrey K
Home Financials for this Owner
Home Financials are based on the most recent Mortgage that was taken out on this home.
Original Mortgage
$295,000
Interest Rate
5.77%
Mortgage Type
New Conventional
Purchase Details
Closed on
Aug 31, 2005
Sold by
Cox Jeffrey and Cox Julia Marie
Bought by
Cox Jeffrey Kenneth and Cox Julia Marie
Purchase Details
Closed on
Mar 15, 1991
Bought by
Cox Jeffrey K
Create a Home Valuation Report for This Property
The Home Valuation Report is an in-depth analysis detailing your home's value as well as a comparison with similar homes in the area
Home Values in the Area
Average Home Value in this Area
Purchase History
| Date | Buyer | Sale Price | Title Company |
|---|---|---|---|
| Cox Jeffrey K | -- | Fidelity National Title Co | |
| Cox Jeffrey K | -- | Fidelity National Title Co | |
| Cox Jeffrey Kenneth | -- | -- | |
| Cox Jeffrey K | $300,000 | -- |
Source: Public Records
Mortgage History
| Date | Status | Borrower | Loan Amount |
|---|---|---|---|
| Open | Cox Jeffrey K | $298,000 | |
| Closed | Cox Jeffrey K | $295,000 |
Source: Public Records
Tax History Compared to Growth
Tax History
| Year | Tax Paid | Tax Assessment Tax Assessment Total Assessment is a certain percentage of the fair market value that is determined by local assessors to be the total taxable value of land and additions on the property. | Land | Improvement |
|---|---|---|---|---|
| 2025 | $5,951 | $541,042 | $225,433 | $315,609 |
| 2024 | $5,951 | $530,434 | $221,013 | $309,421 |
| 2023 | $5,951 | $520,034 | $216,680 | $303,354 |
| 2022 | $5,604 | $509,838 | $212,432 | $297,406 |
| 2021 | $5,498 | $499,842 | $208,267 | $291,575 |
| 2020 | $5,477 | $494,718 | $206,132 | $288,586 |
| 2019 | $5,514 | $485,019 | $202,091 | $282,928 |
| 2018 | $5,472 | $475,510 | $198,129 | $277,381 |
| 2017 | $5,344 | $466,188 | $194,245 | $271,943 |
| 2016 | $5,289 | $457,048 | $190,437 | $266,611 |
| 2015 | $5,117 | $450,184 | $187,577 | $262,607 |
| 2014 | $4,924 | $441,366 | $183,903 | $257,463 |
Source: Public Records
Map
Nearby Homes
- 4713 Circle b Place
- 2880 Creekside Rd
- 4127 Siskiyou Ave
- 1941 Calavaras Dr
- 4068 Siskiyou Ave
- 2913 Carissa Ct
- 1925 Contra Costa Ave
- 906 Woodlake Dr
- 4604 Parktrail Ct
- 2566 Tachevah Dr
- 4774 Carissa Ave
- 2625 Neotomas Ave
- 2944 Yulupa Ave
- 4799 Shade Tree Ln
- 3541 Foxwood Place
- 2303 Sierra Creek Cir
- 4754 Wild Meadow Reach
- 2530 Tachevah Dr
- 1824 Arroyo Sierra Ct
- 3735 Sacramento Ave
- 2179 Alejandro Dr
- 2555 Horseshoe Dr
- 2561 Horseshoe Dr
- 2551 Horseshoe Dr
- 2170 San Antonio Dr
- 2175 Alejandro Dr
- 2163 San Antonio Dr
- 2176 Alejandro Dr
- 2547 Horseshoe Dr
- 3299 Summerfield Rd
- 2168 San Antonio Dr
- 2171 Alejandro Dr
- 2157 San Antonio Dr
- 2140 Contra Costa Ave
- 2144 Contra Costa Ave
- 2560 Horseshoe Dr
- 2164 San Antonio Dr
- 2546 Horseshoe Dr
- 2138 Contra Costa Ave
- 3373 Summerfield Rd