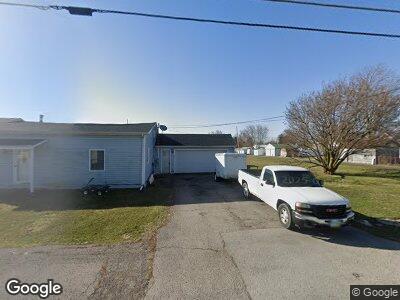
2180 Twp Rd 36 Mount Cory, OH 45868
Estimated Value: $219,000 - $229,000
3
Beds
2
Baths
1,844
Sq Ft
$122/Sq Ft
Est. Value
About This Home
This home is located at 2180 Twp Rd 36, Mount Cory, OH 45868 and is currently estimated at $225,479, approximately $122 per square foot. 2180 Twp Rd 36 is a home located in Hancock County with nearby schools including Cory-Rawson Elementary School and Cory-Rawson High School.
Ownership History
Date
Name
Owned For
Owner Type
Purchase Details
Closed on
Nov 29, 2018
Sold by
Hogan Sara J
Bought by
Junge Megan Danielle
Current Estimated Value
Home Financials for this Owner
Home Financials are based on the most recent Mortgage that was taken out on this home.
Original Mortgage
$118,000
Outstanding Balance
$105,361
Interest Rate
4.8%
Mortgage Type
New Conventional
Estimated Equity
$109,950
Purchase Details
Closed on
Sep 11, 2017
Sold by
Yant Tonya M and Reichley Toyna M
Bought by
Hogan Sara J
Home Financials for this Owner
Home Financials are based on the most recent Mortgage that was taken out on this home.
Original Mortgage
$70,000
Interest Rate
3.9%
Mortgage Type
New Conventional
Purchase Details
Closed on
Aug 7, 2012
Sold by
Reichley Tonya M and Yant Tonya M
Bought by
Riker Dane L and Hogan Sara J
Purchase Details
Closed on
Feb 13, 1986
Bought by
Reichley Gary D
Purchase Details
Closed on
Nov 8, 1985
Bought by
Citizens National Bank Of
Create a Home Valuation Report for This Property
The Home Valuation Report is an in-depth analysis detailing your home's value as well as a comparison with similar homes in the area
Home Values in the Area
Average Home Value in this Area
Purchase History
| Date | Buyer | Sale Price | Title Company |
|---|---|---|---|
| Junge Megan Danielle | $125,000 | None Available | |
| Hogan Sara J | $95,000 | None Available | |
| Riker Dane L | $95,000 | None Available | |
| Reichley Gary D | $52,300 | -- | |
| Citizens National Bank Of | -- | -- |
Source: Public Records
Mortgage History
| Date | Status | Borrower | Loan Amount |
|---|---|---|---|
| Open | Junge Megan Danielle | $118,000 | |
| Previous Owner | Hogan Sara J | $70,000 | |
| Previous Owner | Yant Tonya M | $37,100 | |
| Previous Owner | Yant Tonya M | $40,000 |
Source: Public Records
Tax History Compared to Growth
Tax History
| Year | Tax Paid | Tax Assessment Tax Assessment Total Assessment is a certain percentage of the fair market value that is determined by local assessors to be the total taxable value of land and additions on the property. | Land | Improvement |
|---|---|---|---|---|
| 2024 | $1,723 | $54,370 | $7,720 | $46,650 |
| 2023 | $1,716 | $54,370 | $7,720 | $46,650 |
| 2022 | $1,725 | $54,370 | $7,720 | $46,650 |
| 2021 | $1,568 | $44,070 | $7,560 | $36,510 |
| 2020 | $1,546 | $44,070 | $7,560 | $36,510 |
| 2019 | $1,510 | $44,070 | $7,560 | $36,510 |
| 2018 | $1,435 | $43,320 | $7,720 | $35,600 |
| 2017 | $714 | $43,320 | $7,720 | $35,600 |
| 2016 | $1,468 | $43,320 | $7,720 | $35,600 |
| 2015 | $1,394 | $43,420 | $7,720 | $35,700 |
| 2014 | $1,407 | $43,420 | $7,720 | $35,700 |
| 2012 | $1,413 | $40,180 | $7,720 | $32,460 |
Source: Public Records
Map
Nearby Homes
- 202 S Main St
- 17297 Township Road 51
- 16392 County Road 12
- 0 State Route 12
- 151 Riley St
- 0 County Road 15 Unit C 6127499
- 0 Hidden Trails Dr Unit 6127301
- 625 Lausanne Ave
- 0 County Road 12
- 204 N Jackson St
- 312 W Elm St
- 409 W Elm St
- 131 N Spring St
- 112 Magnolia Ln
- 442 Cherry St
- 18875 County Road 12
- 0 State Route 103
- 108 S Spring St
- 41 Salome Cir
- 110 Sally Ln Unit 110
- 2180 Twp Rd 36
- 2180 Township Road 36
- 2515 Township Road 36
- 2475 Township Road 36
- 1720 County Road 26
- 2633 Trail 36
- 2633 Township Road 36
- 2633 Tr
- 2647 Township Road 36
- 2285 County Road 26
- 2450 Township Road 35
- 2445 County Road 26
- 2495 County Road 26
- 2345 County Road 26
- 2495 Cr
- 2170 County Road 26
- 2396 County Road 26
- 2503 County Road 26
- 2393 County Road 26