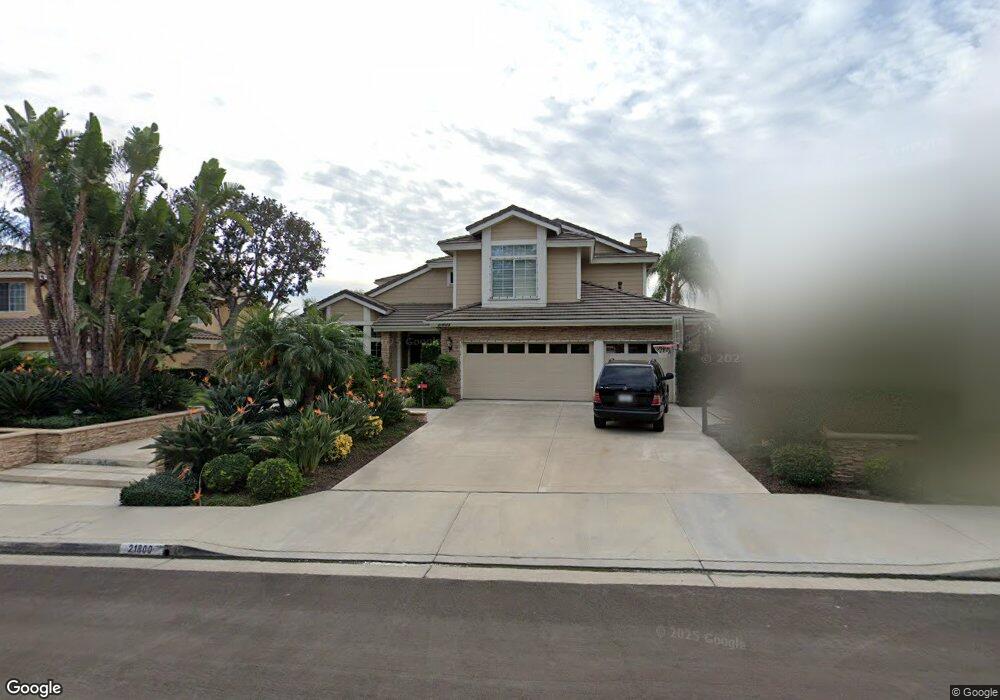
21800 Deveron Cove Yorba Linda, CA 92887
Estimated Value: $2,063,000 - $2,191,237
4
Beds
3
Baths
3,122
Sq Ft
$672/Sq Ft
Est. Value
About This Home
This home is located at 21800 Deveron Cove, Yorba Linda, CA 92887 and is currently estimated at $2,097,559, approximately $671 per square foot. 21800 Deveron Cove is a home located in Orange County with nearby schools including Travis Ranch Middle School, Yorba Linda High School, and Ivycrest Montessori Private School - Yorba Linda.
Ownership History
Date
Name
Owned For
Owner Type
Purchase Details
Closed on
May 6, 2011
Sold by
Walton Douglas D and Watzel Walton Gretchen L
Bought by
Walton Douglas D and Wetzel Walton Gretchen L
Current Estimated Value
Purchase Details
Closed on
Dec 27, 1999
Sold by
Walton Douglas D
Bought by
Walton Douglas D and Wetzel Walton Gretchen L
Home Financials for this Owner
Home Financials are based on the most recent Mortgage that was taken out on this home.
Original Mortgage
$113,600
Outstanding Balance
$36,094
Interest Rate
7.84%
Estimated Equity
$2,061,465
Purchase Details
Closed on
Apr 14, 1995
Sold by
Walton Gretchen L
Bought by
Walton Douglas D
Purchase Details
Closed on
Feb 8, 1995
Sold by
Warmington Yorba Linda Associates Lp
Bought by
Walton Douglas D
Home Financials for this Owner
Home Financials are based on the most recent Mortgage that was taken out on this home.
Original Mortgage
$249,900
Interest Rate
8.12%
Create a Home Valuation Report for This Property
The Home Valuation Report is an in-depth analysis detailing your home's value as well as a comparison with similar homes in the area
Home Values in the Area
Average Home Value in this Area
Purchase History
| Date | Buyer | Sale Price | Title Company |
|---|---|---|---|
| Walton Douglas D | -- | None Available | |
| Walton Douglas D | -- | Benefit Land Title Company | |
| Walton Douglas D | -- | First American Title Ins Co | |
| Walton Douglas D | $460,000 | First American Title Ins |
Source: Public Records
Mortgage History
| Date | Status | Borrower | Loan Amount |
|---|---|---|---|
| Open | Walton Douglas D | $113,600 | |
| Previous Owner | Walton Douglas D | $249,900 |
Source: Public Records
Tax History Compared to Growth
Tax History
| Year | Tax Paid | Tax Assessment Tax Assessment Total Assessment is a certain percentage of the fair market value that is determined by local assessors to be the total taxable value of land and additions on the property. | Land | Improvement |
|---|---|---|---|---|
| 2025 | $10,269 | $885,314 | $337,183 | $548,131 |
| 2024 | $10,269 | $867,955 | $330,571 | $537,384 |
| 2023 | $10,084 | $850,937 | $324,089 | $526,848 |
| 2022 | $9,968 | $834,252 | $317,734 | $516,518 |
| 2021 | $9,785 | $817,895 | $311,504 | $506,391 |
| 2020 | $9,689 | $809,509 | $308,310 | $501,199 |
| 2019 | $9,348 | $793,637 | $302,265 | $491,372 |
| 2018 | $9,139 | $778,076 | $296,338 | $481,738 |
| 2017 | $9,069 | $762,820 | $290,527 | $472,293 |
| 2016 | $8,890 | $747,863 | $284,830 | $463,033 |
| 2015 | $8,784 | $736,630 | $280,552 | $456,078 |
| 2014 | $8,529 | $722,201 | $275,056 | $447,145 |
Source: Public Records
Map
Nearby Homes
- 21630 Dunrobin Way
- 21925 Heatheridge Dr
- 21620 Brisbane Way
- Cielo Vista 3 Plan at Cielo Vista
- Cielo Vista Plan at Cielo Vista
- Cielo Vista 4 Plan at Cielo Vista
- 5830 Via Del Bisonte
- 21451 Cloud Ridge
- 21395 Via Del Lobo
- 8180 E Brookdale Ln
- 6020 Via Santana
- 5795 Via Perla
- 5055 Twilight Canyon Rd
- 5320 Silver Canyon Rd Unit 15A
- 6180 Via Nietos
- 5160 Twilight Canyon Rd Unit G
- 5170 Twilight Canyon Rd Unit 25E
- 1082 N Lynwood Dr
- 20770 Paseo de la Rambla
- 4855 Green Crest Dr
- 21790 Deveron Cove
- 21810 Deveron Cove
- 21820 Deveron Cove
- 21780 Deveron Cove
- 21800 Heatherwood Ln
- 21770 Deveron Cove
- 21830 Deveron Cove
- 21810 Heatherwood Ln
- 21760 Deveron Cove
- 21775 Heatherwood Ln
- 21840 Deveron Cove
- 21785 Heatherwood Ln
- 21820 Heatherwood Ln
- 21795 Heatherwood Ln
- 5075 Greenhaven St
- 5065 Greenhaven St
- 21750 Deveron Cove Unit 11
- 21805 Heatherwood Ln
- 21850 Deveron Cove
- 21830 Heatherwood Ln