21805 W Vernon Ridge Dr Mundelein, IL 60060
Ivanhoe NeighborhoodEstimated Value: $933,011 - $1,083,000
5
Beds
4
Baths
4,170
Sq Ft
$237/Sq Ft
Est. Value
About This Home
This home is located at 21805 W Vernon Ridge Dr, Mundelein, IL 60060 and is currently estimated at $986,503, approximately $236 per square foot. 21805 W Vernon Ridge Dr is a home located in Lake County with nearby schools including Fremont Elementary School, Fremont Intermediate School, and Fremont Jr High/Middle School.
Ownership History
Date
Name
Owned For
Owner Type
Purchase Details
Closed on
Oct 15, 2009
Sold by
Chicago Title Land Trust Company
Bought by
Wolff Michael D and Wolff Nadine
Current Estimated Value
Purchase Details
Closed on
Jul 15, 2003
Sold by
Harris Joseph R and Harris Lynda J
Bought by
Lasalle Bank Na and Trust #131394
Purchase Details
Closed on
Aug 26, 1999
Sold by
Oropeza Charlie E and Oropeza Lolita M
Bought by
Harris Joseph R and Harris Lynda J
Home Financials for this Owner
Home Financials are based on the most recent Mortgage that was taken out on this home.
Original Mortgage
$400,000
Interest Rate
8.21%
Purchase Details
Closed on
Jun 30, 1997
Sold by
Polcon Construction Corp
Bought by
Oropeza Charlie E and Oropeza Lolita M
Home Financials for this Owner
Home Financials are based on the most recent Mortgage that was taken out on this home.
Original Mortgage
$545,250
Interest Rate
6.5%
Create a Home Valuation Report for This Property
The Home Valuation Report is an in-depth analysis detailing your home's value as well as a comparison with similar homes in the area
Home Values in the Area
Average Home Value in this Area
Purchase History
| Date | Buyer | Sale Price | Title Company |
|---|---|---|---|
| Wolff Michael D | -- | None Available | |
| Lasalle Bank Na | $820,000 | St | |
| Harris Joseph R | $694,000 | First American Title | |
| Oropeza Charlie E | $446,666 | -- |
Source: Public Records
Mortgage History
| Date | Status | Borrower | Loan Amount |
|---|---|---|---|
| Previous Owner | Harris Joseph R | $400,000 | |
| Previous Owner | Oropeza Charlie E | $545,250 |
Source: Public Records
Tax History Compared to Growth
Tax History
| Year | Tax Paid | Tax Assessment Tax Assessment Total Assessment is a certain percentage of the fair market value that is determined by local assessors to be the total taxable value of land and additions on the property. | Land | Improvement |
|---|---|---|---|---|
| 2024 | $16,285 | $242,992 | $44,798 | $198,194 |
| 2023 | $16,285 | $222,642 | $41,046 | $181,596 |
| 2022 | $17,883 | $235,412 | $56,591 | $178,821 |
| 2021 | $17,062 | $227,166 | $54,609 | $172,557 |
| 2020 | $17,074 | $220,914 | $53,106 | $167,808 |
| 2019 | $17,714 | $225,752 | $51,273 | $174,479 |
| 2018 | $18,520 | $240,408 | $63,370 | $177,038 |
| 2017 | $18,282 | $232,840 | $61,375 | $171,465 |
| 2016 | $17,960 | $221,141 | $58,291 | $162,850 |
| 2015 | $17,307 | $226,170 | $54,646 | $171,524 |
| 2014 | $17,209 | $207,283 | $52,851 | $154,432 |
| 2012 | $17,271 | $209,123 | $53,320 | $155,803 |
Source: Public Records
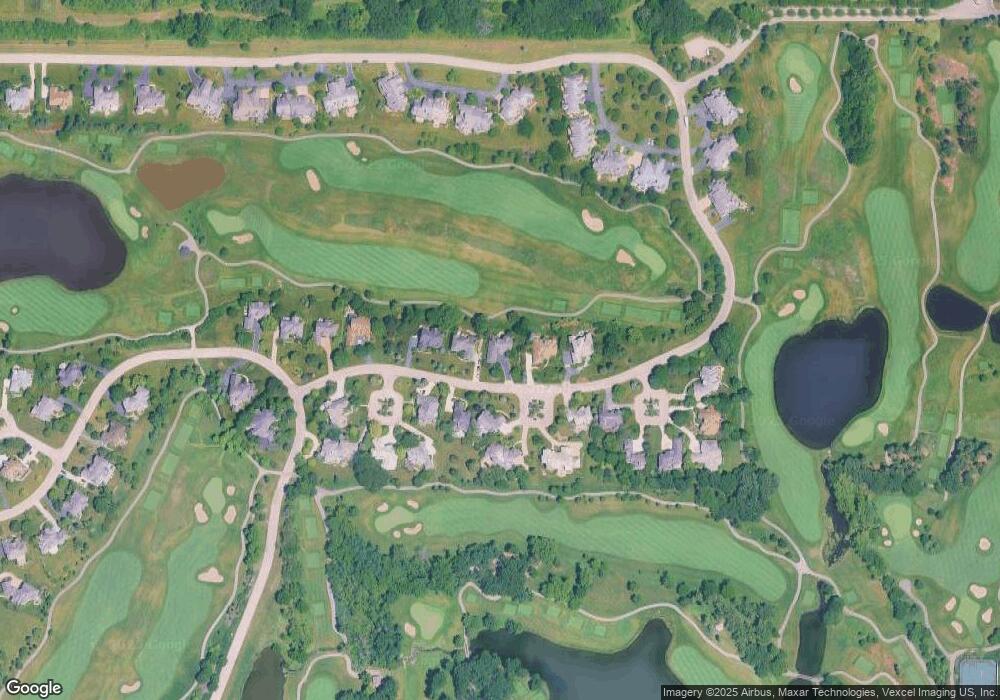
Map
Nearby Homes
- 21787 W Vernon Ridge Dr
- 29026 N Brassie Ct
- 21776 W Jupiter Ct
- 21757 W Jupiter Ct
- 28488 N Seminole Ct
- 1497 Kessler Dr
- 21855 W Murfield Ct
- 3180 Semple Way
- Abbeyville Plan at Sheldon Woods - Meadows
- 3170 Semple Way
- Continental Plan at Sheldon Woods - Meadows
- Newberry Plan at Sheldon Woods - Meadows
- Mercer Plan at Sheldon Woods - Meadows
- 1277 Kessler Dr
- 1104 Joice Ln
- 1114 Joice Ln
- 1084 Joice Ln
- 1267 Kessler Dr
- 1144 Joice Ln
- 1154 Joice Ln
- 21799 W Vernon Ridge Dr
- 21823 W Vernon Ridge Dr
- 29034 N Brassie Ct
- 21835 W Vernon Ridge Dr
- 21802 W Vernon Ridge Dr
- 29043 N Spoon Ct
- 29033 N Brassie Ct
- 29027 N Brassie Ct
- 29042 N Cleek Ct
- 21769 W Vernon Ridge Dr
- 29025 N Spoon Ct
- 29028 N Cleek Ct
- 29040 N Spoon Ct
- 21745 W Vernon Ridge Dr
- 28877 N Sky Crest Dr
- 29025 N Cleek Ct
- 29015 N Sky Crest Dr
- 29051 N Cleek Ct
- 28885 N Sky Crest Dr