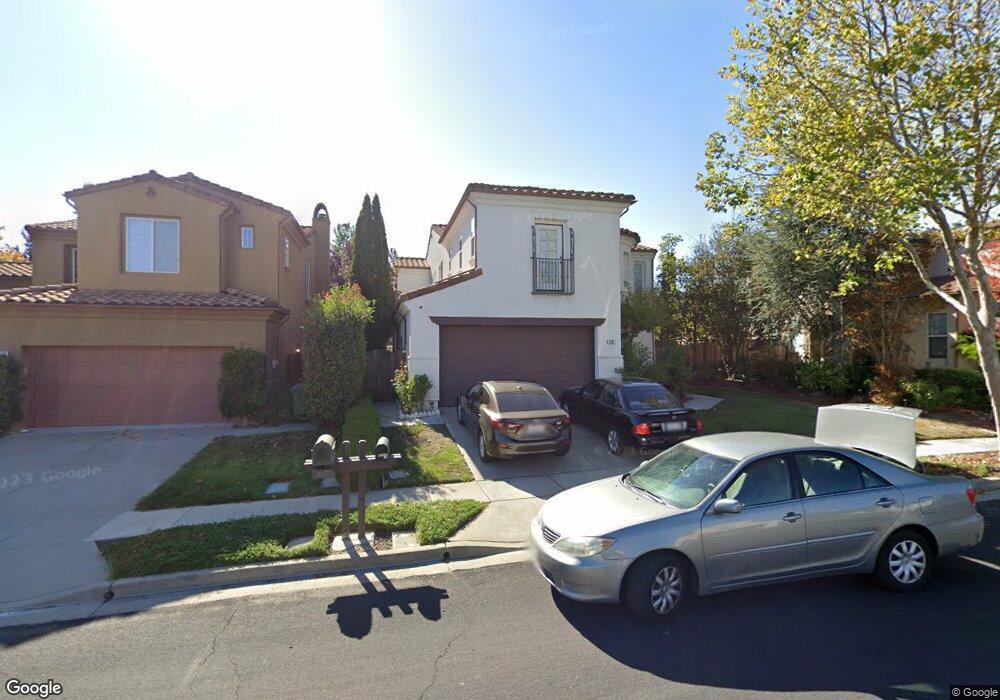
2181 Watercress Place San Ramon, CA 94582
Gale Ranch-Windemere NeighborhoodEstimated Value: $2,063,647 - $2,271,000
4
Beds
3
Baths
2,811
Sq Ft
$777/Sq Ft
Est. Value
About This Home
This home is located at 2181 Watercress Place, San Ramon, CA 94582 and is currently estimated at $2,182,912, approximately $776 per square foot. 2181 Watercress Place is a home located in Contra Costa County with nearby schools including Coyote Creek Elementary School, Gale Ranch Middle School, and Dougherty Valley High School.
Ownership History
Date
Name
Owned For
Owner Type
Purchase Details
Closed on
Jul 12, 2006
Sold by
Tsai Robert W and Chen Yi Lun
Bought by
Tsai Robert W and Chen Yi Lun
Current Estimated Value
Home Financials for this Owner
Home Financials are based on the most recent Mortgage that was taken out on this home.
Original Mortgage
$250,000
Outstanding Balance
$200,469
Interest Rate
6.57%
Mortgage Type
Credit Line Revolving
Estimated Equity
$1,982,443
Purchase Details
Closed on
May 5, 2004
Sold by
Tsai Robert W and Chen Yi Lun
Bought by
Tsai Robert W and Chen Yi Lun
Purchase Details
Closed on
Nov 10, 1998
Sold by
Shapell Industries Inc
Bought by
Tsai Robert W
Home Financials for this Owner
Home Financials are based on the most recent Mortgage that was taken out on this home.
Original Mortgage
$100,200
Interest Rate
6.54%
Mortgage Type
Purchase Money Mortgage
Create a Home Valuation Report for This Property
The Home Valuation Report is an in-depth analysis detailing your home's value as well as a comparison with similar homes in the area
Home Values in the Area
Average Home Value in this Area
Purchase History
| Date | Buyer | Sale Price | Title Company |
|---|---|---|---|
| Tsai Robert W | -- | California Title Company Of | |
| Tsai Robert W | -- | -- | |
| Tsai Robert W | -- | -- | |
| Tsai Robert W | $501,500 | Financial Title Company |
Source: Public Records
Mortgage History
| Date | Status | Borrower | Loan Amount |
|---|---|---|---|
| Open | Tsai Robert W | $250,000 | |
| Closed | Tsai Robert W | $100,200 |
Source: Public Records
Tax History Compared to Growth
Tax History
| Year | Tax Paid | Tax Assessment Tax Assessment Total Assessment is a certain percentage of the fair market value that is determined by local assessors to be the total taxable value of land and additions on the property. | Land | Improvement |
|---|---|---|---|---|
| 2025 | $11,091 | $785,427 | $263,362 | $522,065 |
| 2024 | $10,903 | $770,028 | $258,199 | $511,829 |
| 2023 | $10,903 | $754,931 | $253,137 | $501,794 |
| 2022 | $10,750 | $740,129 | $248,174 | $491,955 |
| 2021 | $10,473 | $725,617 | $243,308 | $482,309 |
| 2019 | $10,192 | $704,097 | $236,093 | $468,004 |
| 2018 | $9,810 | $690,292 | $231,464 | $458,828 |
| 2017 | $9,450 | $676,758 | $226,926 | $449,832 |
| 2016 | $9,291 | $663,489 | $222,477 | $441,012 |
| 2015 | $9,142 | $653,524 | $219,136 | $434,388 |
| 2014 | $8,994 | $640,723 | $214,844 | $425,879 |
Source: Public Records
Map
Nearby Homes
- 460 Bollinger Canyon Ln Unit 286
- 2222 Dewberry Dr
- 221 Victory Cir
- 242 Eastridge Dr
- 346 Eastridge Dr
- 332 Eastridge Dr Unit 66
- 162 Eastridge Dr Unit 185
- 164 Eastridge Dr
- 408 Ustilago Ct
- 775 Watson Canyon Ct Unit 240
- 246 Copper Ridge Rd Unit 85
- 122 Eastridge Dr
- 115 Sapphire Ct
- 805 Watson Canyon Ct Unit 163
- 340 S Overlook Dr
- 2150 Canyon Lakes Dr
- 2520 Canyon Lakes Dr
- 5436 Heatherland Dr
- 6192 Lakeview Cir
- 6206 Lakeview Cir
- 2177 Watercress Place
- 2185 Watercress Place
- 2169 Watercress Place
- 2178 Watercress Place
- 2174 Watercress Place
- 2182 Watercress Place
- 2165 Watercress Place
- 133 Black Calla Ct
- 2252 Dewberry Dr
- 2162 Watercress Place
- 2161 Watercress Place
- 129 Black Calla Ct
- 460 Bollinger Canyon Ln Unit 185
- 460 Bollinger Canyon Ln Unit 385
- 460 Bollinger Canyon Ln Unit 186
- 460 Bollinger Canyon Ln Unit 285
- 460 Bollinger Canyon Ln Unit 187
- 460 Bollinger Canyon Ln Unit 386
- 460 Bollinger Canyon Ln Unit 284
- 460 Bollinger Canyon Ln