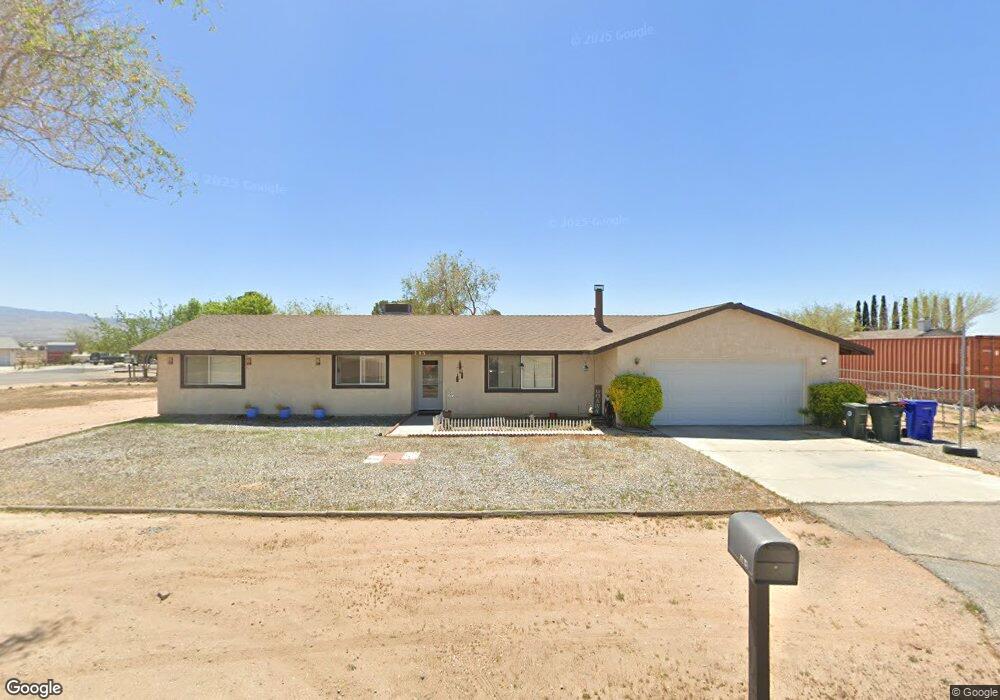
21815 Little Beaver Rd Apple Valley, CA 92308
High Desert NeighborhoodEstimated Value: $347,533 - $406,000
3
Beds
2
Baths
1,256
Sq Ft
$297/Sq Ft
Est. Value
About This Home
This home is located at 21815 Little Beaver Rd, Apple Valley, CA 92308 and is currently estimated at $373,633, approximately $297 per square foot. 21815 Little Beaver Rd is a home located in San Bernardino County with nearby schools including Sandia Elementary School and Apple Valley High School.
Ownership History
Date
Name
Owned For
Owner Type
Purchase Details
Closed on
Dec 6, 2001
Sold by
The John & Sandra Mcmahon 2000 Revocable
Bought by
Mcmahon John F and Mcmahon Sandra G
Current Estimated Value
Home Financials for this Owner
Home Financials are based on the most recent Mortgage that was taken out on this home.
Original Mortgage
$250,000
Outstanding Balance
$98,413
Interest Rate
6.67%
Mortgage Type
Credit Line Revolving
Estimated Equity
$275,220
Purchase Details
Closed on
Sep 10, 2001
Sold by
Ashlock Julius K
Bought by
Mcmahon John F and Mcmahon Sandra G
Home Financials for this Owner
Home Financials are based on the most recent Mortgage that was taken out on this home.
Original Mortgage
$60,775
Interest Rate
6.84%
Mortgage Type
Purchase Money Mortgage
Purchase Details
Closed on
May 17, 2000
Sold by
Mcmahon John F
Bought by
Mcmahon John F and Mcmahon Sandra G
Create a Home Valuation Report for This Property
The Home Valuation Report is an in-depth analysis detailing your home's value as well as a comparison with similar homes in the area
Home Values in the Area
Average Home Value in this Area
Purchase History
| Date | Buyer | Sale Price | Title Company |
|---|---|---|---|
| Mcmahon John F | -- | Fidelity National Title Ins | |
| Mcmahon John F | $182,500 | First American Title | |
| Mcmahon John F | -- | -- |
Source: Public Records
Mortgage History
| Date | Status | Borrower | Loan Amount |
|---|---|---|---|
| Open | Mcmahon John F | $250,000 | |
| Previous Owner | Mcmahon John F | $60,775 |
Source: Public Records
Tax History Compared to Growth
Tax History
| Year | Tax Paid | Tax Assessment Tax Assessment Total Assessment is a certain percentage of the fair market value that is determined by local assessors to be the total taxable value of land and additions on the property. | Land | Improvement |
|---|---|---|---|---|
| 2025 | $1,532 | $127,306 | $22,481 | $104,825 |
| 2024 | $1,532 | $124,810 | $22,040 | $102,770 |
| 2023 | $1,518 | $122,363 | $21,608 | $100,755 |
| 2022 | $1,494 | $119,963 | $21,184 | $98,779 |
| 2021 | $1,461 | $117,611 | $20,769 | $96,842 |
| 2020 | $1,442 | $116,405 | $20,556 | $95,849 |
| 2019 | $1,416 | $114,123 | $20,153 | $93,970 |
| 2018 | $1,381 | $111,885 | $19,758 | $92,127 |
| 2017 | $1,362 | $109,692 | $19,371 | $90,321 |
| 2016 | $1,281 | $107,541 | $18,991 | $88,550 |
| 2015 | $1,262 | $105,926 | $18,706 | $87,220 |
| 2014 | $1,245 | $103,851 | $18,340 | $85,511 |
Source: Public Records
Map
Nearby Homes
- 21928 Maumee Rd
- 0 Chief Joseph Rd
- 12945 Osage Rd
- 0 Little Beaver Rd Unit HD25073438
- 0 Pahute Rd Unit HD25164188
- 22035 Pahute Rd
- 22020 Nisqually Rd Unit 3
- 22020 Nisqually Rd Unit 49
- 12409 Pawnee Rd
- 12744 Running Deer Rd
- 13076 Chief Joseph Rd
- 12650 Running Deer Rd
- 12358 Sioux Rd
- 21512 Pahute Rd
- 12848 Clallam Rd
- 0 Sioux Rd
- 22241 Nisqually Rd Unit 118
- 22241 Nisqually Rd Unit 121
- 22241 Nisqually Rd Unit 38
- 22241 Nisqually Rd Unit 20
- 12712 Pawnee Rd
- 12735 Chief Joseph Rd
- 12768 Pawnee Rd
- 12711 Chief Joseph Rd
- 12706 Pawnee Rd
- 12721 Pawnee Rd
- 12765 Chief Joseph Rd
- 12711 Pawnee Rd
- 12703 Chief Joseph Rd
- 12765 Pawnee Rd
- 12774 Pawnee Rd
- 12726 Chief Joseph Rd
- 12785 Chief Joseph Rd
- 12785 Pawnee Rd
- 12740 Chief Joseph Rd
- 12782 Pawnee Rd
- 12750 Chief Joseph Rd
- 12805 Chief Joseph Rd
- 12712 Chief Joseph Rd
- 12774 Chief Joseph Rd