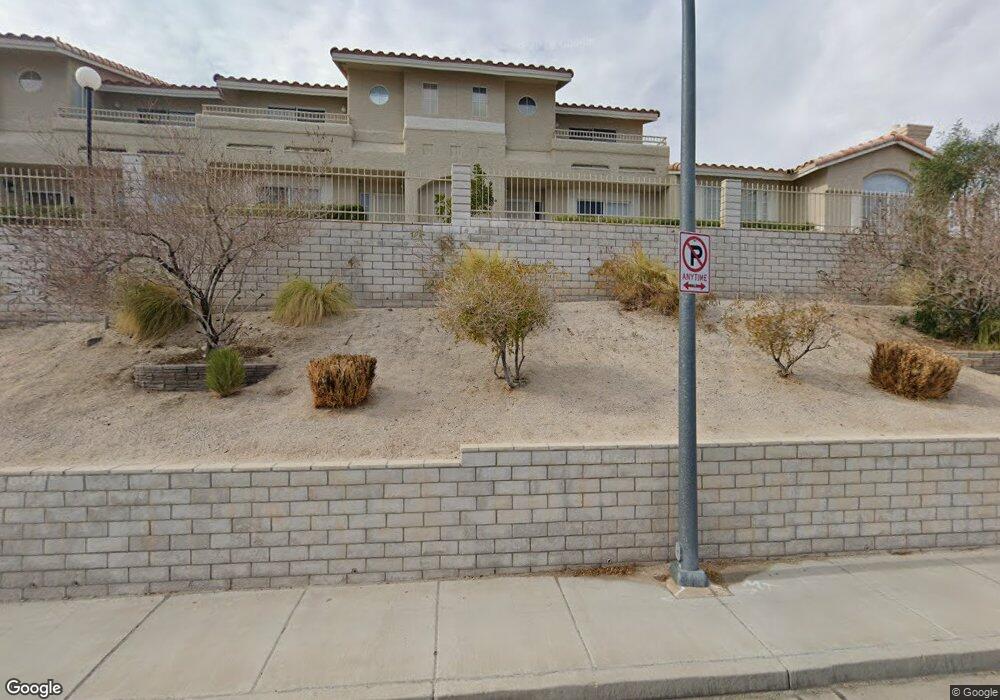
2182 Camel Mesa Dr Laughlin, NV 89029
Estimated Value: $221,586 - $364,000
2
Beds
3
Baths
1,617
Sq Ft
$167/Sq Ft
Est. Value
About This Home
This home is located at 2182 Camel Mesa Dr, Laughlin, NV 89029 and is currently estimated at $270,397, approximately $167 per square foot. 2182 Camel Mesa Dr is a home located in Clark County with nearby schools including William G. Bennett Elementary School and Laughlin Junior/Senior High School.
Ownership History
Date
Name
Owned For
Owner Type
Purchase Details
Closed on
Jan 30, 2025
Sold by
Klainak La-Ong and Everett Gary
Bought by
Jaroensuk Haruthai
Current Estimated Value
Purchase Details
Closed on
Nov 12, 2002
Sold by
Wagner Patrick
Bought by
Everett Gary L and Klainak La Ong
Home Financials for this Owner
Home Financials are based on the most recent Mortgage that was taken out on this home.
Original Mortgage
$135,800
Interest Rate
6.03%
Purchase Details
Closed on
Nov 21, 1998
Sold by
Herbert Marie D
Bought by
Wagner Patrick
Home Financials for this Owner
Home Financials are based on the most recent Mortgage that was taken out on this home.
Original Mortgage
$100,000
Interest Rate
6.84%
Purchase Details
Closed on
Nov 29, 1993
Sold by
Durable Homes Inc
Bought by
Herbert Walter J and Herbert Marie D
Create a Home Valuation Report for This Property
The Home Valuation Report is an in-depth analysis detailing your home's value as well as a comparison with similar homes in the area
Purchase History
| Date | Buyer | Sale Price | Title Company |
|---|---|---|---|
| Jaroensuk Haruthai | -- | None Listed On Document | |
| Everett Gary L | $148,000 | Nevada Title Company | |
| Wagner Patrick | $127,500 | Nevada Title Company | |
| Herbert Walter J | $128,000 | Stewart Title |
Source: Public Records
Mortgage History
| Date | Status | Borrower | Loan Amount |
|---|---|---|---|
| Previous Owner | Everett Gary L | $135,800 | |
| Previous Owner | Wagner Patrick | $100,000 |
Source: Public Records
Tax History
| Year | Tax Paid | Tax Assessment Tax Assessment Total Assessment is a certain percentage of the fair market value that is determined by local assessors to be the total taxable value of land and additions on the property. | Land | Improvement |
|---|---|---|---|---|
| 2026 | $1,441 | $67,071 | $11,900 | $55,171 |
| 2025 | $1,400 | $67,295 | $11,550 | $55,745 |
| 2024 | $1,360 | $67,295 | $11,550 | $55,745 |
| 2023 | $1,360 | $68,562 | $17,500 | $51,062 |
| 2022 | $1,320 | $62,203 | $13,650 | $48,553 |
| 2021 | $1,282 | $52,958 | $12,950 | $40,008 |
| 2020 | $1,242 | $54,098 | $12,250 | $41,848 |
| 2019 | $1,206 | $51,695 | $10,150 | $41,545 |
| 2018 | $1,171 | $43,244 | $8,750 | $34,494 |
| 2017 | $1,608 | $47,423 | $7,700 | $39,723 |
| 2016 | $1,108 | $39,291 | $7,700 | $31,591 |
| 2015 | $1,106 | $31,469 | $5,600 | $25,869 |
| 2014 | -- | $31,509 | $7,000 | $24,509 |
Source: Public Records
Map
Nearby Homes
- 2176 Camel Mesa Dr
- 2194 Camel Mesa Dr
- 2207 Camel Mesa Dr
- 2225 Chandler Ranch Place
- 2175 Limestone Cove Ct
- 2208 Rugged Mesa Dr
- 2160 Highpointe Dr Unit 102
- 2935 Shimmering Bay St
- 2223 Rugged Mesa Dr
- 2180 Highpointe Dr Unit 203
- 2269 Chandler Ranch Place
- 2926 Shimmering Bay St
- 2200 Highpointe Dr Unit 201
- 2200 Highpointe Dr Unit 202
- 2081 Hunt Woods Ct
- 2192 Aspen Mirror Way Unit 102
- 2173 Aspen Mirror Way Unit 101
- 2288 Camel Mesa Dr
- 2293 Chandler Ranch Place
- 2078 Willow Bay Rd
- 2180 Camel Mesa Dr
- 2178 Camel Mesa Dr
- 2174 Camel Mesa Dr
- 2858 Beacon Rock Dr
- 2862 Beacon Rock Dr
- 2192 Camel Mesa Dr
- 2170 Camel Mesa Dr
- 2866 Beacon Rock Dr
- 2168 Camel Mesa Dr
- 2196 Camel Mesa Dr
- 2166 Camel Mesa Dr
- 2205 Chandler Ranch Place
- 2875 Rippling Springs St
- 2198 Camel Mesa Dr
- 2209 Chandler Ranch Place
- 2164 Camel Mesa Dr
- 2870 Beacon Rock Dr
- 2200 Camel Mesa Dr
- 2855 Rippling Springs St
- 2885 Rippling Springs St
Your Personal Tour Guide
Ask me questions while you tour the home.