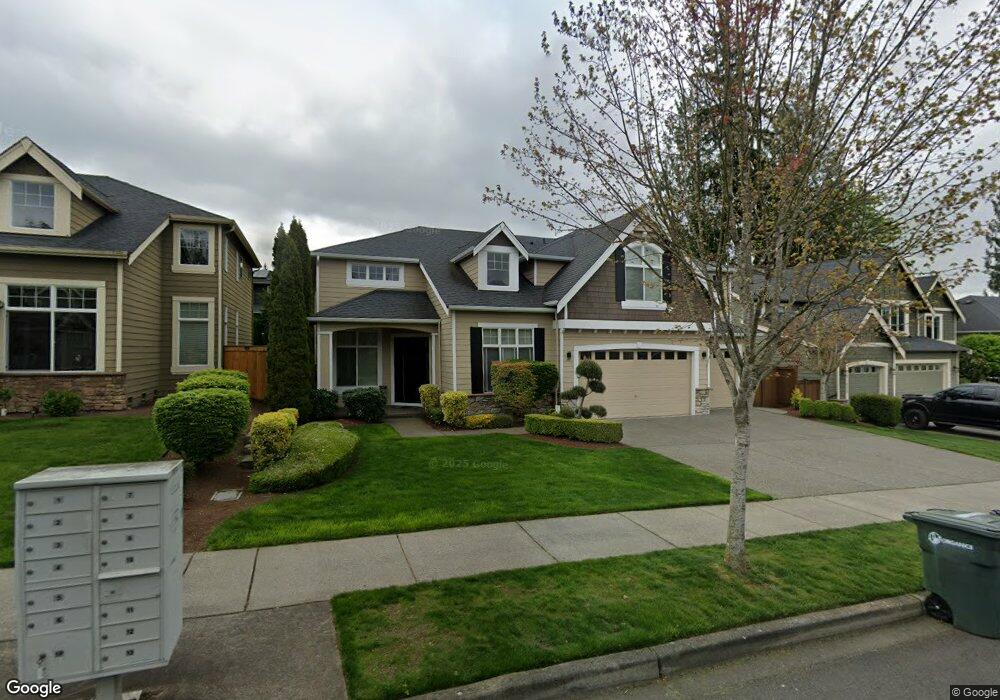
21827 32nd Ave SE Bothell, WA 98021
Canyon Creek NeighborhoodEstimated Value: $1,656,000 - $1,866,000
5
Beds
3
Baths
3,249
Sq Ft
$548/Sq Ft
Est. Value
About This Home
This home is located at 21827 32nd Ave SE, Bothell, WA 98021 and is currently estimated at $1,779,886, approximately $547 per square foot. 21827 32nd Ave SE is a home located in Snohomish County with nearby schools including Canyon Creek Elementary School, Skyview Middle School, and North Creek High School.
Ownership History
Date
Name
Owned For
Owner Type
Purchase Details
Closed on
Apr 17, 2024
Sold by
Surani Amin Mohamed and Surani Fatima Amin
Bought by
Amin Mohamed Surani And Fatima Amin Surani Tr and Surani
Current Estimated Value
Purchase Details
Closed on
Jun 4, 2012
Sold by
Surani Amin Mohammed and Surani Fatima Amin
Bought by
Surani Mohammed and Surani Fatima Amin
Purchase Details
Closed on
Jul 15, 2009
Sold by
Select Homes Inc
Bought by
Surani Amin G and Surani Fatima A
Home Financials for this Owner
Home Financials are based on the most recent Mortgage that was taken out on this home.
Original Mortgage
$455,960
Interest Rate
5.31%
Mortgage Type
Purchase Money Mortgage
Create a Home Valuation Report for This Property
The Home Valuation Report is an in-depth analysis detailing your home's value as well as a comparison with similar homes in the area
Home Values in the Area
Average Home Value in this Area
Purchase History
| Date | Buyer | Sale Price | Title Company |
|---|---|---|---|
| Amin Mohamed Surani And Fatima Amin Surani Tr | $313 | None Listed On Document | |
| Surani Mohammed | -- | None Available | |
| Surani Amin G | $570,230 | Chicago Title |
Source: Public Records
Mortgage History
| Date | Status | Borrower | Loan Amount |
|---|---|---|---|
| Previous Owner | Surani Amin G | $455,960 |
Source: Public Records
Tax History
| Year | Tax Paid | Tax Assessment Tax Assessment Total Assessment is a certain percentage of the fair market value that is determined by local assessors to be the total taxable value of land and additions on the property. | Land | Improvement |
|---|---|---|---|---|
| 2025 | $12,136 | $1,467,500 | $882,000 | $585,500 |
| 2024 | $11,663 | $1,406,400 | $868,100 | $538,300 |
| 2023 | $10,391 | $1,364,200 | $745,000 | $619,200 |
| 2022 | $9,306 | $985,600 | $460,000 | $525,600 |
| 2020 | $9,178 | $902,900 | $420,000 | $482,900 |
| 2019 | $8,207 | $837,100 | $335,000 | $502,100 |
| 2018 | $7,509 | $738,000 | $290,000 | $448,000 |
| 2017 | $6,594 | $656,300 | $235,000 | $421,300 |
| 2016 | $5,876 | $603,800 | $215,000 | $388,800 |
Source: Public Records
Map
Nearby Homes
- 22213 32nd Ave SE
- 21705 38th Dr SE
- 3333 228th St SE Unit 99
- 3333 228th St SE Unit 49
- 3931 221st Place SE
- 4103 220th St SE
- 3918 214th Place SE Unit A
- 4021 220th St SE
- 4001 215th St SE Unit A
- 21407 39th Dr SE Unit A
- 3928 214th Place SE Unit B
- 4026 215th Place SE
- 4215 220th St SE
- 4219 220th St SE
- 4216 220th St SE
- 21903 41st Ave SE
- 4118 220th Place SE
- 4132 220th St SE
- 21708 24th Ave SE Unit A
- 20911 30th Dr SE
- 21833 32nd Ave SE
- 21821 32nd Ave SE
- 21824 33rd Dr SE Unit 5
- 21818 33rd Dr SE Unit 4
- 21907 32nd Ave SE
- 21817 32nd Ave SE
- 3133 219th Place SE
- 21830 33rd Dr SE Unit 6
- 21822 32nd Ave SE
- 21812 33rd Dr SE Unit 3
- 21913 32nd Ave SE
- 3304 219th Place SE Unit 7
- 22007 32nd Ave SE
- 22013 32nd Ave SE
- 3127 219th Place SE
- 21811 32nd Ave SE
- 21816 32nd Ave SE
- 3132 219th Place SE
- 21806 33rd Dr SE Unit 2
- 3310 219th Place SE Unit 8
Your Personal Tour Guide
Ask me questions while you tour the home.