21828 3rd Dr SE Bothell, WA 98021
Queensborough-Brentwood NeighborhoodEstimated Value: $772,804 - $975,000
3
Beds
2
Baths
1,610
Sq Ft
$544/Sq Ft
Est. Value
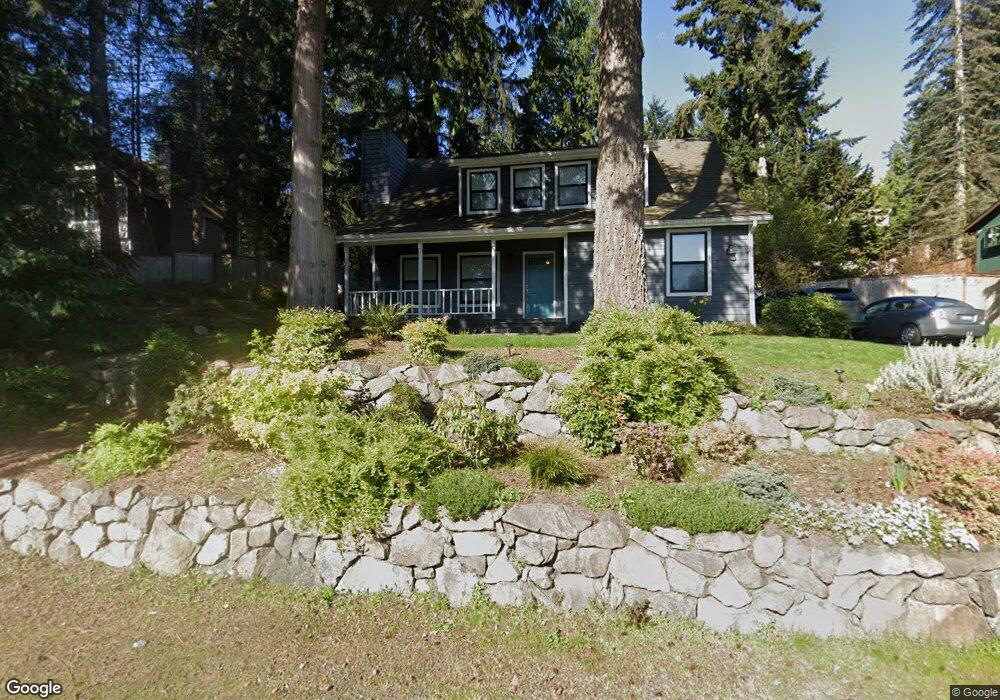
About This Home
This home is located at 21828 3rd Dr SE, Bothell, WA 98021 and is currently estimated at $875,451, approximately $543 per square foot. 21828 3rd Dr SE is a home located in Snohomish County with nearby schools including Shelton View Elementary School, Canyon Park Junior High School, and Bothell High School.
Ownership History
Date
Name
Owned For
Owner Type
Purchase Details
Closed on
Jul 13, 2009
Sold by
Tobin Paul A and Tobin Elisa C
Bought by
Zibits Andrew J and Leigh Naomi
Current Estimated Value
Home Financials for this Owner
Home Financials are based on the most recent Mortgage that was taken out on this home.
Original Mortgage
$328,932
Outstanding Balance
$204,447
Interest Rate
4.87%
Mortgage Type
FHA
Estimated Equity
$671,004
Purchase Details
Closed on
Nov 10, 1995
Sold by
Tobin J William and Tobin Margaret Anne
Bought by
Tobin Paul A and Tobin Elisa C
Home Financials for this Owner
Home Financials are based on the most recent Mortgage that was taken out on this home.
Original Mortgage
$151,200
Interest Rate
6.5%
Purchase Details
Closed on
May 31, 1994
Sold by
Keeley David M and Keeley Mary T
Bought by
Tobin Paul A and Tobin Elisa C
Home Financials for this Owner
Home Financials are based on the most recent Mortgage that was taken out on this home.
Original Mortgage
$151,000
Interest Rate
5.87%
Create a Home Valuation Report for This Property
The Home Valuation Report is an in-depth analysis detailing your home's value as well as a comparison with similar homes in the area
Home Values in the Area
Average Home Value in this Area
Purchase History
| Date | Buyer | Sale Price | Title Company |
|---|---|---|---|
| Zibits Andrew J | $335,000 | Chicago Title | |
| Tobin Paul A | -- | Chicago Title Insurance Co | |
| Tobin Paul A | $159,000 | -- |
Source: Public Records
Mortgage History
| Date | Status | Borrower | Loan Amount |
|---|---|---|---|
| Open | Zibits Andrew J | $328,932 | |
| Previous Owner | Tobin Paul A | $151,200 | |
| Previous Owner | Tobin Paul A | $151,000 |
Source: Public Records
Tax History
| Year | Tax Paid | Tax Assessment Tax Assessment Total Assessment is a certain percentage of the fair market value that is determined by local assessors to be the total taxable value of land and additions on the property. | Land | Improvement |
|---|---|---|---|---|
| 2026 | $6,452 | $805,400 | $562,600 | $242,800 |
| 2025 | $5,688 | $765,000 | $528,700 | $236,300 |
| 2024 | $5,688 | $670,200 | $446,200 | $224,000 |
| 2023 | $7,023 | $911,800 | $649,900 | $261,900 |
| 2022 | $6,293 | $658,800 | $437,500 | $221,300 |
| 2020 | $5,207 | $503,600 | $308,700 | $194,900 |
| 2019 | $4,538 | $453,900 | $262,600 | $191,300 |
| 2018 | $4,162 | $400,700 | $230,400 | $170,300 |
| 2017 | $3,522 | $342,000 | $184,300 | $157,700 |
| 2016 | $3,175 | $318,200 | $168,600 | $149,600 |
| 2015 | $3,168 | $301,400 | $162,500 | $138,900 |
| 2013 | $2,897 | $242,400 | $135,900 | $106,500 |
Source: Public Records
Map
Nearby Homes
- 21707 2nd Ave SE
- 104 219th Place SE
- 21713 Meridian Ave S
- 814 213th St SE
- 19924 7th Dr SE
- 20021 7th Dr SE
- 20027 7th Dr SE
- 738 211th Place SE
- 721 211th Place SE
- 729 211th Place SE
- 809 211th Place SE
- 817 211th Place SE
- 803 211th Place SE
- 33 213th Place SW
- 15 213th Place SW
- 22621 8th Dr SE
- 224 224th St SW
- 21120 Meridian Place W
- 22426 3rd Place W
- 917 228th St SE
- 21820 3rd Dr SE
- 21906 3rd Dr SE
- 21829 3rd Ave SE
- 21821 3rd Ave SE
- 21905 3rd Dr SE
- 21823 3rd Dr SE
- 21812 3rd Dr SE
- 21920 3rd Dr SE
- 21809 3rd Ave SE
- 21913 3rd Dr SE
- 21915 3rd Ave SE
- 21815 3rd Dr SE
- 21804 3rd Dr SE
- 21923 3rd Dr SE
- 21926 3rd Dr SE
- 21805 3rd Ave SE
- 21931 3rd Ave SE
- 21910 4th Dr SE
- 21814 4th Ave SE
- 21822 4th Ave SE
Your Personal Tour Guide
Ask me questions while you tour the home.