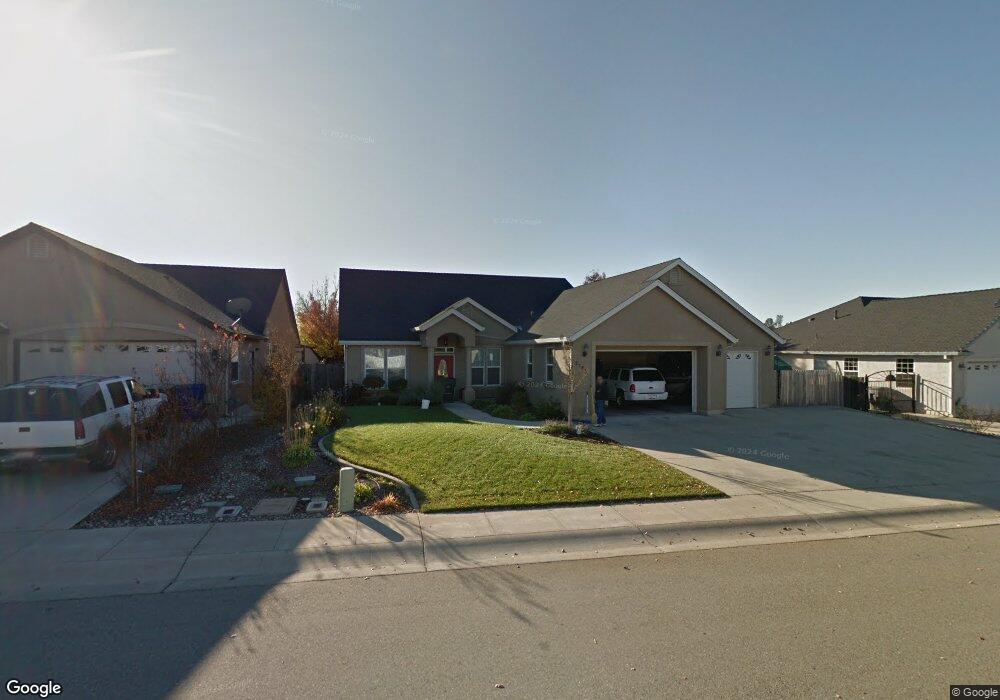
2183 Oshea Way Unit Lot 26 Redding, CA 96003
North Shasta View NeighborhoodEstimated Value: $467,322 - $549,000
3
Beds
2
Baths
2,020
Sq Ft
$251/Sq Ft
Est. Value
About This Home
This home is located at 2183 Oshea Way Unit Lot 26, Redding, CA 96003 and is currently estimated at $506,581, approximately $250 per square foot. 2183 Oshea Way Unit Lot 26 is a home located in Shasta County with nearby schools including Columbia Elementary School, Mountain View Middle School, and Foothill High School.
Ownership History
Date
Name
Owned For
Owner Type
Purchase Details
Closed on
Jan 23, 2025
Sold by
Wogoman Stephen L and Wogoman Coleen A
Bought by
Wogoman Family Trust and Wogoman
Current Estimated Value
Purchase Details
Closed on
Nov 14, 2024
Sold by
Sherman Michael Lee and Sherman Teresa Lynn
Bought by
Sherman Family Trust and Sherman
Purchase Details
Closed on
Oct 11, 2022
Sold by
Boom Derrick and Boom Joanna
Bought by
Boom Family Trust and Boom
Purchase Details
Closed on
May 29, 2012
Sold by
Johnson Dennis R and Johnson Judy L
Bought by
Boom Derrick and Boom Joanna
Home Financials for this Owner
Home Financials are based on the most recent Mortgage that was taken out on this home.
Original Mortgage
$160,000
Interest Rate
3.86%
Mortgage Type
New Conventional
Purchase Details
Closed on
Jul 26, 2004
Sold by
Coughlin Development Corp
Bought by
Johnson Dennis R and Johnson Judy L
Home Financials for this Owner
Home Financials are based on the most recent Mortgage that was taken out on this home.
Original Mortgage
$251,840
Interest Rate
5.37%
Mortgage Type
Purchase Money Mortgage
Create a Home Valuation Report for This Property
The Home Valuation Report is an in-depth analysis detailing your home's value as well as a comparison with similar homes in the area
Home Values in the Area
Average Home Value in this Area
Purchase History
| Date | Buyer | Sale Price | Title Company |
|---|---|---|---|
| Wogoman Family Trust | -- | None Listed On Document | |
| Sherman Family Trust | -- | None Listed On Document | |
| Sherman Family Trust | -- | None Listed On Document | |
| Boom Family Trust | -- | None Listed On Document | |
| Boom Derrick | $317,000 | Fidelity Natl Title Co Of Ca | |
| Johnson Dennis R | $315,000 | Fidelity Natl Title Co Of Ca |
Source: Public Records
Mortgage History
| Date | Status | Borrower | Loan Amount |
|---|---|---|---|
| Previous Owner | Boom Derrick | $160,000 | |
| Previous Owner | Johnson Dennis R | $251,840 | |
| Closed | Johnson Dennis R | $47,220 |
Source: Public Records
Tax History Compared to Growth
Tax History
| Year | Tax Paid | Tax Assessment Tax Assessment Total Assessment is a certain percentage of the fair market value that is determined by local assessors to be the total taxable value of land and additions on the property. | Land | Improvement |
|---|---|---|---|---|
| 2025 | $4,110 | $398,155 | $50,235 | $347,920 |
| 2024 | $4,129 | $390,349 | $49,250 | $341,099 |
| 2023 | $4,129 | $382,696 | $48,285 | $334,411 |
| 2022 | $3,993 | $375,193 | $47,339 | $327,854 |
| 2021 | $3,965 | $367,837 | $46,411 | $321,426 |
| 2020 | $3,934 | $364,067 | $45,936 | $318,131 |
| 2019 | $3,844 | $356,930 | $45,036 | $311,894 |
| 2018 | $3,873 | $349,932 | $44,153 | $305,779 |
| 2017 | $3,921 | $343,072 | $43,288 | $299,784 |
| 2016 | $3,667 | $336,346 | $42,440 | $293,906 |
| 2015 | $3,610 | $331,295 | $41,803 | $289,492 |
| 2014 | $3,519 | $324,807 | $40,985 | $283,822 |
Source: Public Records
Map
Nearby Homes
- 2238 Sophy Place
- 1401 Casa Vereda Way
- 1891 Edgewood Dr
- 1187 Kirkwood Cir
- 2517 Atrium Way
- 1802 Whaley Ct
- 1090 Gibralter Rd
- 1063 Belcrest Dr
- 2030 Hedgerow Ave
- 2293 Milano Trail
- 1945 Salzburg Trail
- Stacey Plan at Sonata
- Caroline Plan at Sonata
- Rosie Plan at Sonata
- Leah Plan at Sonata
- 1610 Oakdale Ct
- 1511 Oakdale Ln
- 2164 Oxford Rd
- 1285 Lancers Ln
- 1565 Becky Way
- 2183 Oshea Way
- 2173 Oshea Way
- 2193 Oshea Way
- 2170 Darsha Ln
- 2198 Darsha Ln
- 2163 Oshea Way Unit Lot 24
- 2163 Oshea Way
- 2156 Darsha Ln
- 2178 Oshea Way
- 2205 Oshea Cir Unit 1
- 2205 Oshea Cir
- 2205 O'Shea
- 2140 Darsha Ln
- 2166 Oshea Way Unit Lot 4
- 2166 Oshea Way
- 2226 Darsha Ln
- 0 Darsha Ln
- 1476 Oak Mesa Ln
- 2220 Oshea Cir
- 2220 O'Shea