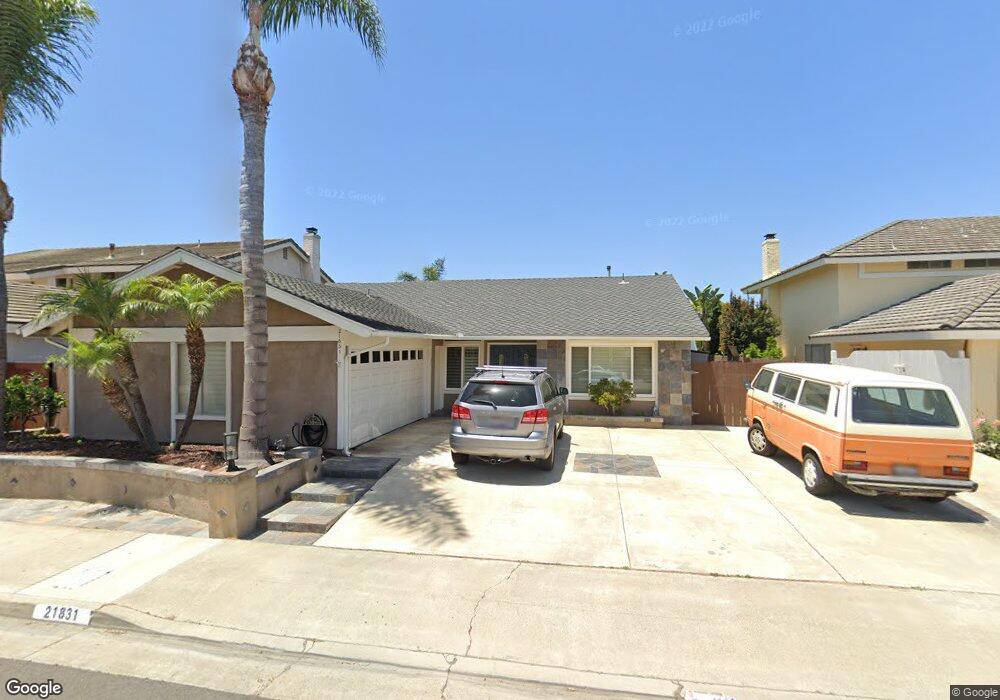
21831 Seacrest Ln Huntington Beach, CA 92646
Southeast NeighborhoodEstimated Value: $1,695,000 - $1,849,000
3
Beds
2
Baths
1,971
Sq Ft
$885/Sq Ft
Est. Value
About This Home
This home is located at 21831 Seacrest Ln, Huntington Beach, CA 92646 and is currently estimated at $1,743,389, approximately $884 per square foot. 21831 Seacrest Ln is a home located in Orange County with nearby schools including John H. Eader Elementary School, Isaac L. Sowers Middle School, and Edison High School.
Ownership History
Date
Name
Owned For
Owner Type
Purchase Details
Closed on
Mar 26, 2008
Sold by
Keeton Steven M
Bought by
Mcpherson Philip J and Mcpherson Heather M
Current Estimated Value
Home Financials for this Owner
Home Financials are based on the most recent Mortgage that was taken out on this home.
Original Mortgage
$417,000
Outstanding Balance
$264,428
Interest Rate
5.99%
Mortgage Type
Purchase Money Mortgage
Estimated Equity
$1,478,961
Purchase Details
Closed on
Dec 12, 2003
Sold by
Pilkerton Paul T and Pilkerton Tricia A
Bought by
Keeton Steven M
Home Financials for this Owner
Home Financials are based on the most recent Mortgage that was taken out on this home.
Original Mortgage
$549,200
Interest Rate
5.62%
Mortgage Type
Purchase Money Mortgage
Purchase Details
Closed on
Nov 20, 1998
Sold by
Clow Byron 3Rd
Bought by
Pilkerton Paul T and Pilkerton Tricia A
Create a Home Valuation Report for This Property
The Home Valuation Report is an in-depth analysis detailing your home's value as well as a comparison with similar homes in the area
Home Values in the Area
Average Home Value in this Area
Purchase History
| Date | Buyer | Sale Price | Title Company |
|---|---|---|---|
| Mcpherson Philip J | $765,000 | First American Title Company | |
| Keeton Steven M | $686,500 | Fidelity National Title Co | |
| Pilkerton Paul T | $332,000 | -- |
Source: Public Records
Mortgage History
| Date | Status | Borrower | Loan Amount |
|---|---|---|---|
| Open | Mcpherson Philip J | $417,000 | |
| Previous Owner | Keeton Steven M | $549,200 |
Source: Public Records
Tax History Compared to Growth
Tax History
| Year | Tax Paid | Tax Assessment Tax Assessment Total Assessment is a certain percentage of the fair market value that is determined by local assessors to be the total taxable value of land and additions on the property. | Land | Improvement |
|---|---|---|---|---|
| 2025 | $11,253 | $1,004,835 | $816,856 | $187,979 |
| 2024 | $11,253 | $985,133 | $800,839 | $184,294 |
| 2023 | $11,004 | $965,817 | $785,136 | $180,681 |
| 2022 | $10,717 | $946,880 | $769,741 | $177,139 |
| 2021 | $10,518 | $928,314 | $754,648 | $173,666 |
| 2020 | $10,450 | $918,796 | $746,910 | $171,886 |
| 2019 | $10,325 | $900,781 | $732,265 | $168,516 |
| 2018 | $10,166 | $883,119 | $717,907 | $165,212 |
| 2017 | $10,031 | $865,803 | $703,830 | $161,973 |
| 2016 | $9,582 | $848,827 | $690,029 | $158,798 |
| 2015 | $9,492 | $836,077 | $679,664 | $156,413 |
| 2014 | $9,145 | $806,000 | $662,882 | $143,118 |
Source: Public Records
Map
Nearby Homes
- 21722 Hilaria Cir
- 21861 Vacation Ln
- 21941 Oceanview Ln
- 22102 Wood Island Ln
- 21382 Lemontree Ln
- 21621 Kaneohe Ln
- 21361 Lemontree Ln
- 21662 Brookhurst St Unit D
- 9552 Castine Dr
- 9171 Regatta Dr
- 9581 Chevy Chase Dr
- 9112 Playa Dr
- 9121 Christine Dr
- 9021 Niguel Cir
- 9802 Effingham Dr
- 21221 Hillsdale Ln
- 1170 Gleneagles Terrace
- 1269 Westreef
- 9221 Belcaro Dr
- 21211 Poston Ln
- 21821 Seacrest Ln Unit 115
- 21841 Seacrest Ln
- 21832 Oceanview Ln
- 21842 Oceanview Ln
- 21822 Oceanview Ln
- 21851 Seacrest Ln
- 21801 Seacrest Ln
- 21832 Seacrest Ln
- 21852 Oceanview Ln
- 21802 Oceanview Ln
- 21822 Seacrest Ln
- 21842 Seacrest Ln
- 21861 Seacrest Ln
- 9561 Beachside Dr
- 21852 Seacrest Ln
- 21862 Oceanview Ln
- 21792 Oceanview Ln
- 9581 Beachside Dr
- 21871 Seacrest Ln
- 21862 Seacrest Ln