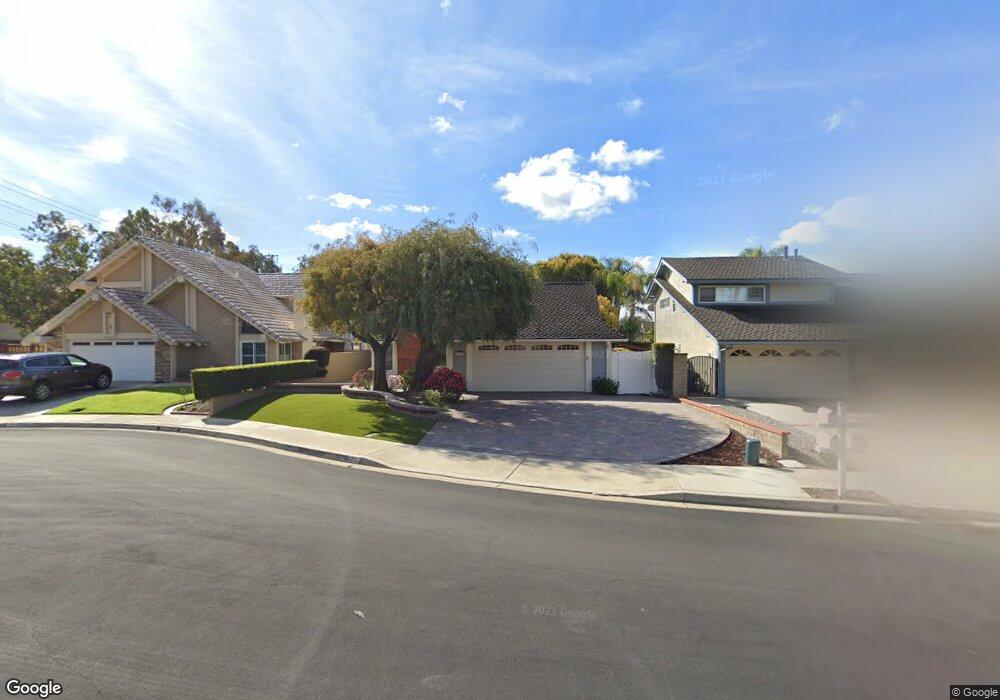
21836 Tumbleweed Cir Lake Forest, CA 92630
Estimated Value: $1,104,187 - $1,214,000
3
Beds
2
Baths
1,494
Sq Ft
$768/Sq Ft
Est. Value
About This Home
This home is located at 21836 Tumbleweed Cir, Lake Forest, CA 92630 and is currently estimated at $1,146,797, approximately $767 per square foot. 21836 Tumbleweed Cir is a home located in Orange County with nearby schools including La Madera Elementary School, Serrano Intermediate School, and El Toro High School.
Ownership History
Date
Name
Owned For
Owner Type
Purchase Details
Closed on
Sep 15, 2006
Sold by
Reynolds James W and Reynolds Vicki L
Bought by
Reynolds James W and Reynolds Vicki L
Current Estimated Value
Purchase Details
Closed on
Jan 15, 2003
Sold by
Reynolds Vicki L and May Vicki L
Bought by
Reynolds James W and Reynolds Vicki L
Home Financials for this Owner
Home Financials are based on the most recent Mortgage that was taken out on this home.
Original Mortgage
$250,200
Outstanding Balance
$106,349
Interest Rate
5.97%
Estimated Equity
$1,040,448
Purchase Details
Closed on
May 25, 1997
Sold by
Jenkins Clyde J and Otis John Otis
Bought by
May Vicki L
Home Financials for this Owner
Home Financials are based on the most recent Mortgage that was taken out on this home.
Original Mortgage
$176,500
Interest Rate
7.94%
Purchase Details
Closed on
Nov 7, 1996
Sold by
Jenkins Clyde J and Jenkins Gladys Gladys
Bought by
Jenkins Clyde J and The Clyde J Jenkins Revocable Trust
Create a Home Valuation Report for This Property
The Home Valuation Report is an in-depth analysis detailing your home's value as well as a comparison with similar homes in the area
Home Values in the Area
Average Home Value in this Area
Purchase History
| Date | Buyer | Sale Price | Title Company |
|---|---|---|---|
| Reynolds James W | -- | None Available | |
| Reynolds James W | -- | None Available | |
| Reynolds James W | -- | -- | |
| May Vicki L | $196,500 | Old Republic Title Company | |
| Jenkins Clyde J | -- | -- |
Source: Public Records
Mortgage History
| Date | Status | Borrower | Loan Amount |
|---|---|---|---|
| Open | Reynolds James W | $250,200 | |
| Closed | May Vicki L | $176,500 |
Source: Public Records
Tax History Compared to Growth
Tax History
| Year | Tax Paid | Tax Assessment Tax Assessment Total Assessment is a certain percentage of the fair market value that is determined by local assessors to be the total taxable value of land and additions on the property. | Land | Improvement |
|---|---|---|---|---|
| 2025 | $3,223 | $313,748 | $144,397 | $169,351 |
| 2024 | $3,223 | $307,597 | $141,566 | $166,031 |
| 2023 | $3,147 | $301,566 | $138,790 | $162,776 |
| 2022 | $3,091 | $295,653 | $136,068 | $159,585 |
| 2021 | $3,030 | $289,856 | $133,400 | $156,456 |
| 2020 | $3,003 | $286,884 | $132,032 | $154,852 |
| 2019 | $2,943 | $281,259 | $129,443 | $151,816 |
| 2018 | $2,888 | $275,745 | $126,905 | $148,840 |
| 2017 | $2,830 | $270,339 | $124,417 | $145,922 |
| 2016 | $2,784 | $265,039 | $121,978 | $143,061 |
| 2015 | $2,750 | $261,058 | $120,145 | $140,913 |
| 2014 | $2,618 | $255,945 | $117,792 | $138,153 |
Source: Public Records
Map
Nearby Homes
- 25495 Morningstar Rd
- 25761 Le Parc Unit 82
- 25761 Le Parc Unit 89
- 25671 Le Parc Unit 85
- 25671 Le Parc Unit 82
- 25712 Le Parc Unit 7
- 25631 Mont Pointe Unit 7D
- 25971 Donegal Ln
- 22201 Center Pointe Unit 2D
- 25912 Densmore Dr
- 25614 Mont Pointe Unit 3D
- 25644 Mont Pointe Unit 1A
- 25154 Mammoth Cir
- 25152 Mammoth Cir
- 21472 Firwood Unit 9
- 25162 Chestnutwood Unit 47
- 25272 Birch Grove Ln
- 21324 Balsam Ln
- 22461 Silver Spur
- 24975 Heartwood Cir
- 21842 Tumbleweed Cir
- 21832 Tumbleweed Cir
- 21846 Tumbleweed Cir
- 21895 Red River Dr
- 21881 Red River Dr
- 21891 Red River Dr
- 21852 Tumbleweed Cir
- 21885 Red River Dr
- 21841 Tumbleweed Cir
- 21835 Tumbleweed Cir
- 21831 Tumbleweed Cir
- 21856 Tumbleweed Cir
- 21901 Red River Dr
- 21851 Tumbleweed Cir
- 21862 Tumbleweed Cir
- 21855 Tumbleweed Cir
- 21882 Red River Dr
- 21905 Red River Dr
- 21792 Sweetgrass Cir
- 21786 Sweetgrass Cir