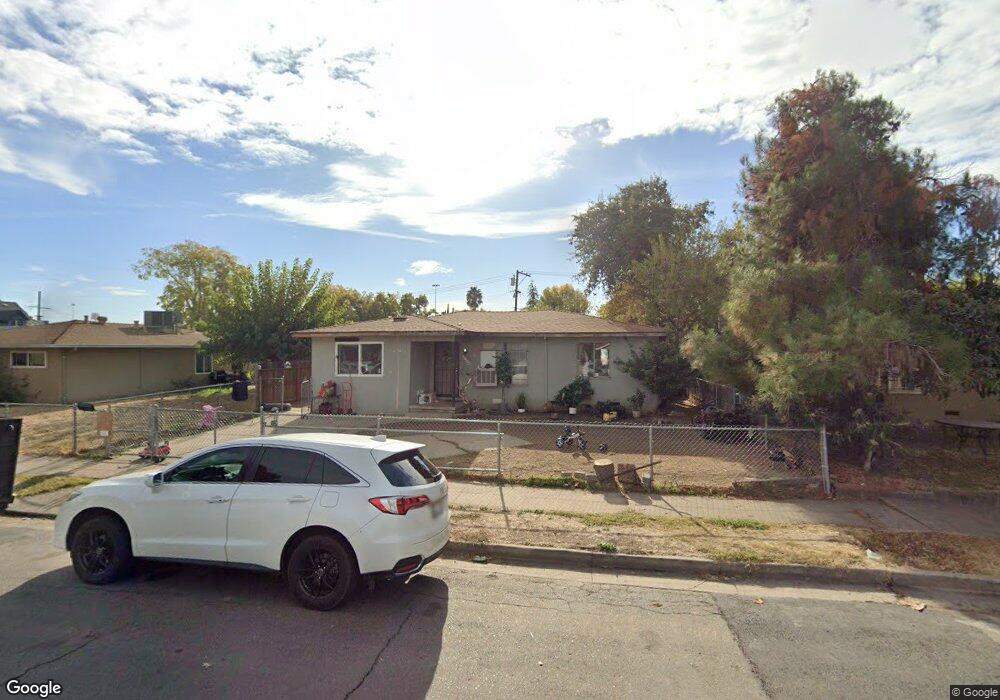
2184 E Hazelton Ave Stockton, CA 95205
East Stockton NeighborhoodEstimated Value: $314,000 - $330,000
3
Beds
2
Baths
1,158
Sq Ft
$278/Sq Ft
Est. Value
About This Home
This home is located at 2184 E Hazelton Ave, Stockton, CA 95205 and is currently estimated at $322,097, approximately $278 per square foot. 2184 E Hazelton Ave is a home located in San Joaquin County with nearby schools including King Elementary School, Roosevelt Elementary School, and Fillmore Elementary School.
Ownership History
Date
Name
Owned For
Owner Type
Purchase Details
Closed on
May 14, 2019
Sold by
Glaze Evelyn
Bought by
Glaze Everlyn and Glaze James
Current Estimated Value
Home Financials for this Owner
Home Financials are based on the most recent Mortgage that was taken out on this home.
Original Mortgage
$143,000
Outstanding Balance
$125,213
Interest Rate
4%
Mortgage Type
New Conventional
Estimated Equity
$196,884
Purchase Details
Closed on
Sep 27, 2006
Sold by
Glaze James
Bought by
Glaze Evelyn
Purchase Details
Closed on
Apr 25, 2006
Sold by
Glaze Evelyn and Harris Evelyn
Bought by
Glaze James and Glaze Evelyn
Home Financials for this Owner
Home Financials are based on the most recent Mortgage that was taken out on this home.
Original Mortgage
$145,000
Interest Rate
6.5%
Mortgage Type
Purchase Money Mortgage
Purchase Details
Closed on
Jul 29, 2005
Sold by
Tolbert Delthine
Bought by
Harris Evelyn
Create a Home Valuation Report for This Property
The Home Valuation Report is an in-depth analysis detailing your home's value as well as a comparison with similar homes in the area
Home Values in the Area
Average Home Value in this Area
Purchase History
| Date | Buyer | Sale Price | Title Company |
|---|---|---|---|
| Glaze Everlyn | -- | Fidelity National Agency Sln | |
| Glaze Evelyn | -- | None Available | |
| Glaze James | -- | United Capital Title Ins Co | |
| Harris Evelyn | -- | -- |
Source: Public Records
Mortgage History
| Date | Status | Borrower | Loan Amount |
|---|---|---|---|
| Open | Glaze Everlyn | $143,000 | |
| Closed | Glaze James | $145,000 |
Source: Public Records
Tax History
| Year | Tax Paid | Tax Assessment Tax Assessment Total Assessment is a certain percentage of the fair market value that is determined by local assessors to be the total taxable value of land and additions on the property. | Land | Improvement |
|---|---|---|---|---|
| 2025 | $626 | $46,304 | $7,007 | $39,297 |
| 2024 | $616 | $45,397 | $6,870 | $38,527 |
| 2023 | $602 | $44,508 | $6,736 | $37,772 |
| 2022 | $569 | $43,636 | $6,604 | $37,032 |
| 2021 | $547 | $42,781 | $6,475 | $36,306 |
| 2020 | $557 | $42,343 | $6,409 | $35,934 |
| 2019 | $555 | $41,514 | $6,284 | $35,230 |
| 2018 | $545 | $40,701 | $6,161 | $34,540 |
| 2017 | $517 | $39,904 | $6,041 | $33,863 |
| 2016 | $525 | $39,122 | $5,922 | $33,200 |
| 2014 | $502 | $37,780 | $5,719 | $32,061 |
Source: Public Records
Map
Nearby Homes
- 2217 E Hazelton Ave
- 2362 Alma St
- 2006 E Lafayette St
- 2415 E Taylor St
- 2387 E Lafayette St
- 2497 E Marsh St
- 2477 E Washington St
- 511 Burkett Ave
- 1636 E Anderson St
- 0 Park Unit SR25247647
- 2330 Finland Ave
- 336 S Airport Way
- 2360 Finland Ave
- 29 S Sierra Nevada St
- 1237 E Hazelton Ave
- 213 Rendon Ave
- 1224 E Lafayette St
- 835 S Airport Way
- 345 S Pilgrim St
- 630 N Watts Ave
- 608 S Ash St
- 607 Court St
- 627 Court St
- 632 S Ash St
- 609 S Ash St
- 2165 E Hazelton Ave
- 2185 E Hazelton Ave
- 2163 E Hazelton Ave
- 2191 E Scotts Ave
- 2195 E Hazelton Ave
- 2204 E Hazelton Ave
- 635 S Ash St
- 2158 E Hazelton Ave
- 538 Court St
- 524 S Ash St
- 626 Court St
- 2161 E Hazelton Ave
- 2151 E Scotts Ave
- 518 Court St
Your Personal Tour Guide
Ask me questions while you tour the home.