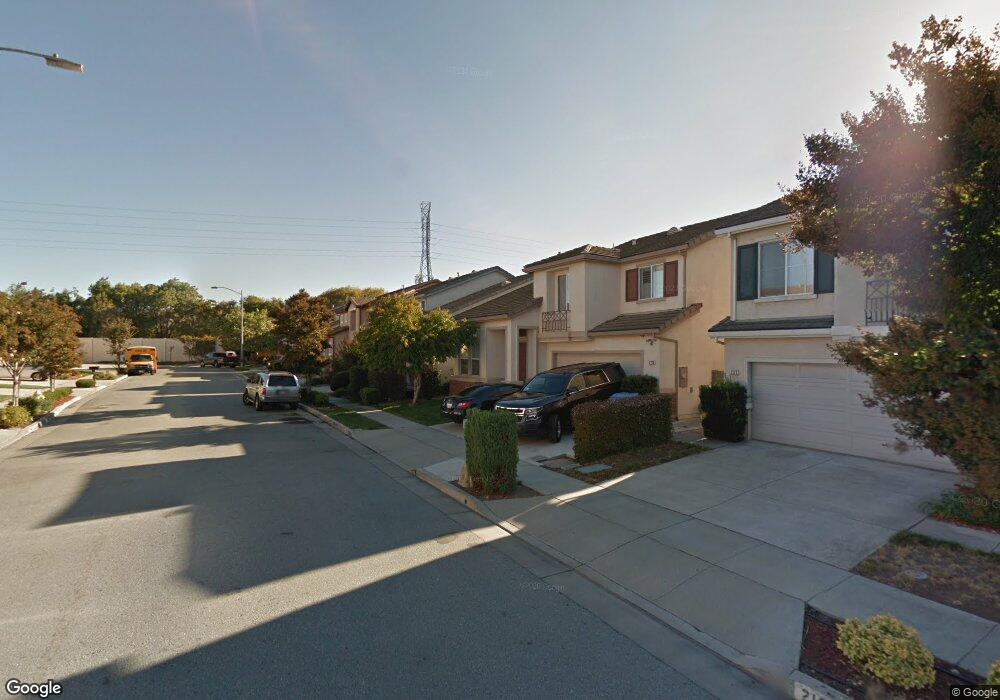
2184 Estee Ct San Jose, CA 95133
Commodore NeighborhoodEstimated Value: $1,413,650 - $1,605,000
3
Beds
3
Baths
1,881
Sq Ft
$798/Sq Ft
Est. Value
About This Home
This home is located at 2184 Estee Ct, San Jose, CA 95133 and is currently estimated at $1,501,913, approximately $798 per square foot. 2184 Estee Ct is a home located in Santa Clara County with nearby schools including Summerdale Elementary School, Piedmont Middle School, and Independence High School.
Ownership History
Date
Name
Owned For
Owner Type
Purchase Details
Closed on
Jan 7, 2014
Sold by
Yip Tony C and Yip Caroline
Bought by
Yip Trust and Yip Caroline
Current Estimated Value
Purchase Details
Closed on
Jun 15, 1998
Sold by
M J Brock & Sons Inc
Bought by
Yip Tony and Yip Caroline
Home Financials for this Owner
Home Financials are based on the most recent Mortgage that was taken out on this home.
Original Mortgage
$200,000
Interest Rate
6.88%
Create a Home Valuation Report for This Property
The Home Valuation Report is an in-depth analysis detailing your home's value as well as a comparison with similar homes in the area
Home Values in the Area
Average Home Value in this Area
Purchase History
| Date | Buyer | Sale Price | Title Company |
|---|---|---|---|
| Yip Trust | -- | None Available | |
| Yip Tony | $377,000 | First American Title Guarant |
Source: Public Records
Mortgage History
| Date | Status | Borrower | Loan Amount |
|---|---|---|---|
| Previous Owner | Yip Tony | $200,000 |
Source: Public Records
Tax History
| Year | Tax Paid | Tax Assessment Tax Assessment Total Assessment is a certain percentage of the fair market value that is determined by local assessors to be the total taxable value of land and additions on the property. | Land | Improvement |
|---|---|---|---|---|
| 2025 | $8,751 | $595,675 | $313,534 | $282,141 |
| 2024 | $8,751 | $583,996 | $307,387 | $276,609 |
| 2023 | $8,581 | $572,546 | $301,360 | $271,186 |
| 2022 | $8,542 | $561,320 | $295,451 | $265,869 |
| 2021 | $8,332 | $550,314 | $289,658 | $260,656 |
| 2020 | $8,067 | $544,672 | $286,688 | $257,984 |
| 2019 | $7,758 | $533,993 | $281,067 | $252,926 |
| 2018 | $7,643 | $523,523 | $275,556 | $247,967 |
| 2017 | $7,680 | $513,258 | $270,153 | $243,105 |
| 2016 | $7,359 | $503,195 | $264,856 | $238,339 |
| 2015 | $7,271 | $495,637 | $260,878 | $234,759 |
| 2014 | $6,619 | $485,929 | $255,768 | $230,161 |
Source: Public Records
Map
Nearby Homes
- 2194 Celeste Ct
- 1062 Rymar Place
- 2465 Sequester Ct
- 1055 N Capitol Ave Unit 167
- 1055 N Capitol Ave Unit 180
- 2083 Bluejacket Way
- 2505 Dillion Ct Unit 3
- 2043 Shellback Place
- 879 Wyman Way Unit 2
- 1252 Turrett Dr
- 1136 Ribisi Cir
- 1135 Pandolfi Place
- 2381 Lava Dr
- 1034 Ribisi Cir
- 1314 Old Abbey Place
- 2758 Boncheff Dr
- 12280 Mabury Rd
- 714 N Capitol Ave
- 636 Messina Gardens Ln
- 1368 Goldenlake Rd
Your Personal Tour Guide
Ask me questions while you tour the home.