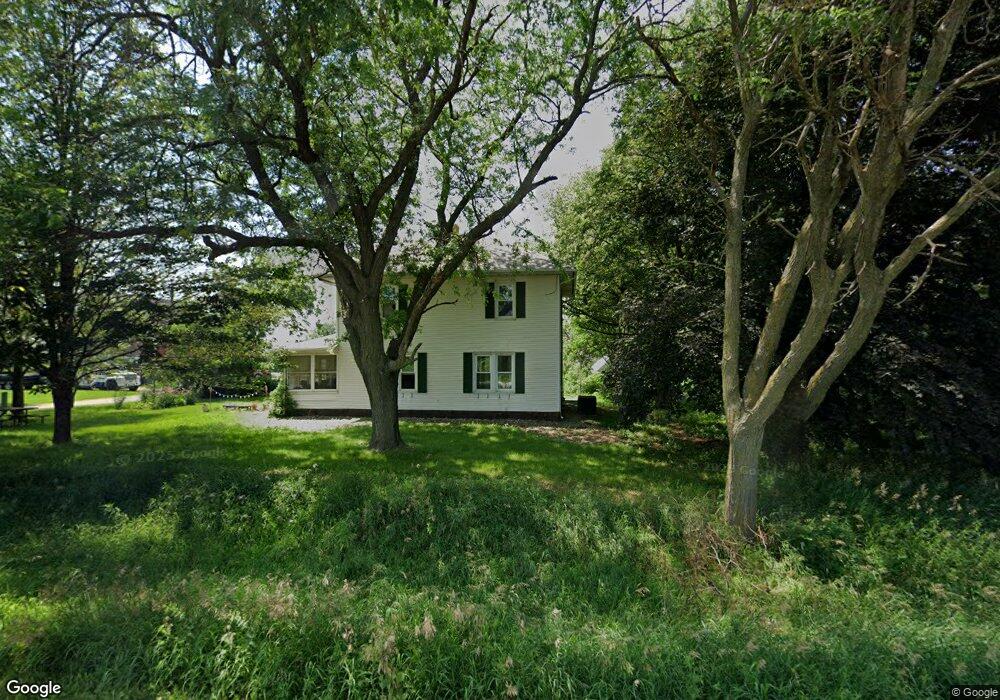
21849 Birch Ave Dumont, IA 50625
Estimated Value: $148,000 - $177,556
3
Beds
1
Bath
1,528
Sq Ft
$108/Sq Ft
Est. Value
About This Home
This home is located at 21849 Birch Ave, Dumont, IA 50625 and is currently estimated at $164,889, approximately $107 per square foot. 21849 Birch Ave is a home located in Butler County with nearby schools including North Side Elementary School, South Side Elementary School, and Hampton-Dumont Middle School.
Ownership History
Date
Name
Owned For
Owner Type
Purchase Details
Closed on
Oct 29, 2013
Sold by
Helmke Kain D and Helmke Nancy F
Bought by
Helmke Bronz D
Current Estimated Value
Home Financials for this Owner
Home Financials are based on the most recent Mortgage that was taken out on this home.
Original Mortgage
$68,550
Interest Rate
4.17%
Mortgage Type
Farmers Home Administration
Purchase Details
Closed on
Nov 22, 2008
Sold by
Helmke Mitchell L and Helmke Kristin L
Bought by
Helmke Bronz D and Helmke Kain D
Home Financials for this Owner
Home Financials are based on the most recent Mortgage that was taken out on this home.
Original Mortgage
$75,000
Interest Rate
6.49%
Mortgage Type
Purchase Money Mortgage
Create a Home Valuation Report for This Property
The Home Valuation Report is an in-depth analysis detailing your home's value as well as a comparison with similar homes in the area
Home Values in the Area
Average Home Value in this Area
Purchase History
| Date | Buyer | Sale Price | Title Company |
|---|---|---|---|
| Helmke Bronz D | -- | None Available | |
| Helmke Bronz D | $85,000 | None Available |
Source: Public Records
Mortgage History
| Date | Status | Borrower | Loan Amount |
|---|---|---|---|
| Previous Owner | Helmke Bronz D | $68,550 | |
| Previous Owner | Helmke Bronz D | $75,000 |
Source: Public Records
Tax History Compared to Growth
Tax History
| Year | Tax Paid | Tax Assessment Tax Assessment Total Assessment is a certain percentage of the fair market value that is determined by local assessors to be the total taxable value of land and additions on the property. | Land | Improvement |
|---|---|---|---|---|
| 2024 | $1,166 | $102,960 | $9,690 | $93,270 |
| 2023 | $1,184 | $102,960 | $9,690 | $93,270 |
| 2022 | $1,142 | $84,140 | $7,460 | $76,680 |
| 2021 | $1,050 | $84,140 | $7,460 | $76,680 |
| 2020 | $1,050 | $74,690 | $7,250 | $67,440 |
| 2019 | $926 | $72,070 | $0 | $0 |
| 2018 | $934 | $72,070 | $0 | $0 |
| 2017 | $934 | $87,360 | $0 | $0 |
| 2016 | $1,302 | $87,360 | $0 | $0 |
| 2015 | $1,302 | $87,360 | $0 | $0 |
| 2014 | $1,310 | $87,450 | $0 | $0 |
Source: Public Records
Map
Nearby Homes