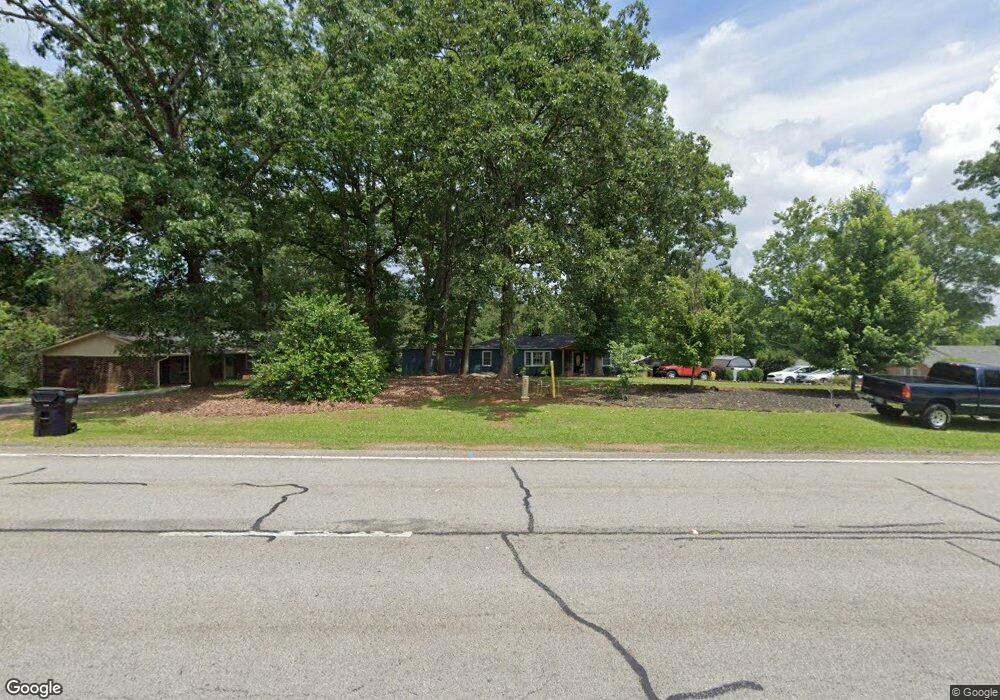
2185 Elberton Hwy Hartwell, GA 30643
Estimated Value: $228,180 - $428,000
3
Beds
2
Baths
1,566
Sq Ft
$184/Sq Ft
Est. Value
About This Home
This home is located at 2185 Elberton Hwy, Hartwell, GA 30643 and is currently estimated at $288,545, approximately $184 per square foot. 2185 Elberton Hwy is a home located in Hart County with nearby schools including Hart County High School.
Ownership History
Date
Name
Owned For
Owner Type
Purchase Details
Closed on
Dec 1, 2022
Sold by
Marti Erika
Bought by
Owens Gary Dean and Marti Erika
Current Estimated Value
Purchase Details
Closed on
Jan 16, 2017
Sold by
Owens Gary Dean
Bought by
Marti Erika
Purchase Details
Closed on
Sep 18, 2009
Sold by
Marti Erika
Bought by
Owens Gary Dean
Home Financials for this Owner
Home Financials are based on the most recent Mortgage that was taken out on this home.
Original Mortgage
$111,089
Interest Rate
5.11%
Mortgage Type
New Conventional
Purchase Details
Closed on
Jan 7, 2009
Sold by
Thornton William F
Bought by
Marti Erika
Home Financials for this Owner
Home Financials are based on the most recent Mortgage that was taken out on this home.
Original Mortgage
$78,750
Interest Rate
5.43%
Mortgage Type
New Conventional
Purchase Details
Closed on
Mar 1, 1999
Purchase Details
Closed on
Mar 1, 1970
Create a Home Valuation Report for This Property
The Home Valuation Report is an in-depth analysis detailing your home's value as well as a comparison with similar homes in the area
Home Values in the Area
Average Home Value in this Area
Purchase History
| Date | Buyer | Sale Price | Title Company |
|---|---|---|---|
| Owens Gary Dean | -- | -- | |
| Marti Erika | -- | -- | |
| Owens Gary Dean | $87,406 | -- | |
| Owens Gary Dean | $87,406 | -- | |
| Marti Erika | $75,000 | -- | |
| -- | -- | -- | |
| -- | -- | -- |
Source: Public Records
Mortgage History
| Date | Status | Borrower | Loan Amount |
|---|---|---|---|
| Previous Owner | Owens Gary Dean | $111,089 | |
| Previous Owner | Marti Erika | $78,750 |
Source: Public Records
Tax History Compared to Growth
Tax History
| Year | Tax Paid | Tax Assessment Tax Assessment Total Assessment is a certain percentage of the fair market value that is determined by local assessors to be the total taxable value of land and additions on the property. | Land | Improvement |
|---|---|---|---|---|
| 2024 | $1,212 | $78,486 | $6,668 | $71,818 |
| 2023 | $1,117 | $67,097 | $5,550 | $61,547 |
| 2022 | $983 | $59,062 | $4,894 | $54,168 |
| 2021 | $921 | $49,642 | $2,600 | $47,042 |
| 2020 | $899 | $46,423 | $2,531 | $43,892 |
| 2019 | $455 | $23,275 | $2,531 | $20,744 |
| 2018 | $475 | $24,041 | $2,531 | $21,510 |
| 2017 | $473 | $23,795 | $2,531 | $21,264 |
| 2016 | $482 | $23,479 | $1,717 | $21,762 |
| 2015 | $468 | $24,016 | $2,140 | $21,876 |
| 2014 | $458 | $23,046 | $1,391 | $21,655 |
| 2013 | -- | $23,886 | $1,391 | $22,495 |
Source: Public Records
Map
Nearby Homes
- 2077 Elberton Hwy
- 373 Liberty Hill Rd Unit 19
- 445 Liberty Hill Rd Unit 22
- 461 Liberty Hill Rd Unit 23
- 587 Liberty Hill Rd Unit 30
- 619 Liberty Hill Rd Unit 32
- 569 Liberty Hill Rd Unit 29
- 521 Liberty Hill Rd Unit 26
- 605 Liberty Hill Rd Unit 31
- 553 Liberty Hill Rd Unit 28
- 173 Deer Creek Farms
- 1528 Hodges Mill Rd
- 875 Benson St
- 175 Deer Creek Farms
- 861 Benson St
- 32 Hart Terrace
- 17 Fairview Station
- 713 Benson St
- 2187 Elberton Hwy
- 2159 Elberton Hwy
- 2200 Elberton Hwy
- 0 Monica Dr Unit 8129917
- 2283 Elberton Hwy
- 2088 Elberton Hwy
- 2281 Elberton Hwy
- 2114 Elberton Hwy
- 192 Eastern Rd
- 2077 Elberton Hwy
- 140 Cateechee Trail
- 62 Monica Dr
- 1987 Elberton Hwy
- 424 Eastern Rd
- 1976 Elberton Hwy
- 1967 Elberton Hwy
- 51 Cline Dr
- 86 Monica Dr
- 591 Eastern Rd
- 391 Eastern Rd