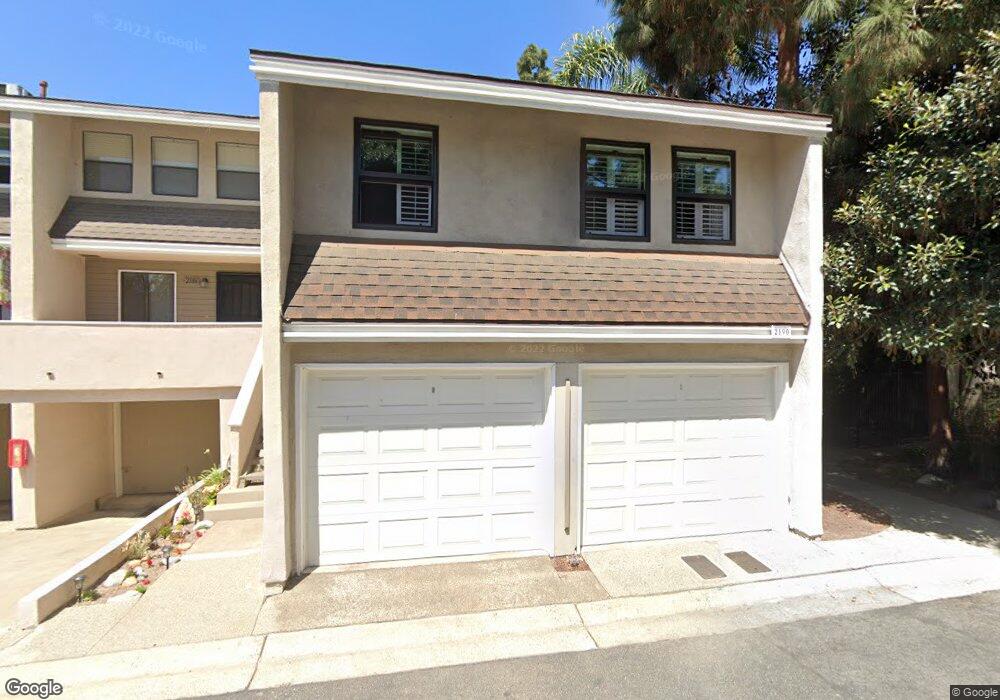
2186 Bosque Springs Unit 18 Costa Mesa, CA 92627
Estimated Value: $470,000 - $730,000
2
Beds
1
Bath
1,282
Sq Ft
$464/Sq Ft
Est. Value
About This Home
This home is located at 2186 Bosque Springs Unit 18, Costa Mesa, CA 92627 and is currently estimated at $595,109, approximately $464 per square foot. 2186 Bosque Springs Unit 18 is a home located in Orange County with nearby schools including College Park Elementary School, Costa Mesa High School, and Christ Lutheran School.
Ownership History
Date
Name
Owned For
Owner Type
Purchase Details
Closed on
Mar 1, 2023
Sold by
Barbra Stoval Martin Gst Exempt Trust
Bought by
Steven Michael Martin Gst Exempt Trust
Current Estimated Value
Purchase Details
Closed on
Mar 9, 2022
Sold by
Marjorie Koldinger Gst Exempt Trust and Stovall Tax Credit Trust
Bought by
Eric J Koldinger Gst Exempt Trust and Koldinger
Purchase Details
Closed on
May 12, 2017
Sold by
Koldinger Marjorie Stovall and Martin Barbra Stovall
Bought by
Koldinger Kurt E and The Marjorie Koldinger Gst Exempt Trust
Purchase Details
Closed on
Aug 5, 2000
Sold by
Martin Barbra Stovall and Koldinger Marjorie Stovall
Bought by
Martin Barbra Stovall and Koldinger Marjorie Stovall
Purchase Details
Closed on
Mar 13, 1996
Sold by
Chard Robin Lindsay and Chard Elizabeth Alys
Bought by
Federal National Mortgage Association
Create a Home Valuation Report for This Property
The Home Valuation Report is an in-depth analysis detailing your home's value as well as a comparison with similar homes in the area
Home Values in the Area
Average Home Value in this Area
Purchase History
| Date | Buyer | Sale Price | Title Company |
|---|---|---|---|
| Steven Michael Martin Gst Exempt Trust | -- | -- | |
| Eric J Koldinger Gst Exempt Trust | -- | None Listed On Document | |
| Kurt E Koldinger Gst Exempt Trust | -- | None Listed On Document | |
| Koldinger Kurt E | -- | None Available | |
| Martin Barbra Stovall | -- | -- | |
| Federal National Mortgage Association | $75,000 | North American Title Co |
Source: Public Records
Tax History Compared to Growth
Tax History
| Year | Tax Paid | Tax Assessment Tax Assessment Total Assessment is a certain percentage of the fair market value that is determined by local assessors to be the total taxable value of land and additions on the property. | Land | Improvement |
|---|---|---|---|---|
| 2025 | $2,652 | $184,027 | $17,670 | $166,357 |
| 2024 | $2,652 | $180,419 | $17,323 | $163,096 |
| 2023 | $2,537 | $176,882 | $16,983 | $159,899 |
| 2022 | $2,361 | $173,414 | $16,650 | $156,764 |
| 2021 | $2,241 | $170,014 | $16,323 | $153,691 |
| 2020 | $2,220 | $168,271 | $16,155 | $152,116 |
| 2019 | $2,183 | $164,972 | $15,838 | $149,134 |
| 2018 | $2,144 | $161,738 | $15,528 | $146,210 |
| 2017 | $2,071 | $158,567 | $15,223 | $143,344 |
| 2016 | $2,028 | $155,458 | $14,924 | $140,534 |
| 2015 | $2,006 | $153,123 | $14,699 | $138,424 |
| 2014 | $1,961 | $150,124 | $14,411 | $135,713 |
Source: Public Records
Map
Nearby Homes
- 404 Brighton Springs
- 2173 Harmony Way
- 416 Hamilton St
- 2191 Harbor Blvd Unit 64
- 2191 Harbor Blvd Unit 75
- 2191 Harbor Blvd Unit 7
- 2191 Harbor Blvd Unit 65
- 2191 Harbor Blvd
- 327 W Wilson St Unit 86
- 327 W Wilson St Unit 49
- 519 Caleigh Ln
- 536 Caleigh Ln
- 535 Hamilton St
- 431 W Bay St Unit D
- 380 W Wilson St Unit C104
- 2214 Rutgers Dr
- 2029 Harbor Blvd
- 2232 Anaheim Ave
- 1973 Newport Blvd Unit 7
- 1973 Newport Blvd Unit 53
- 2184 Bosque Springs Unit 17
- 2184 Bosque Springs
- 2182 Bosque Springs
- 2180 Bosque Springs
- 2188 Bosque Springs Unit 19
- 2190 Bosque Springs Unit 20
- 409 Brighton Springs
- 411 Brighton Springs Unit 10
- 2184 Bosque Springs Rd Unit 17
- 2188 Bosque Springs Rd
- 401 Brighton Springs Unit 13
- 401 Brighton Springs Unit 24
- 2168 Kristin Ln Unit 4
- 427 Bryson Springs
- 425 Bryson Springs
- 423 Bryson Springs Unit 45
- 423 Bryson Springs
- 429 Bryson Springs
- 421 Bryson Springs
- 431 Bryson Springs