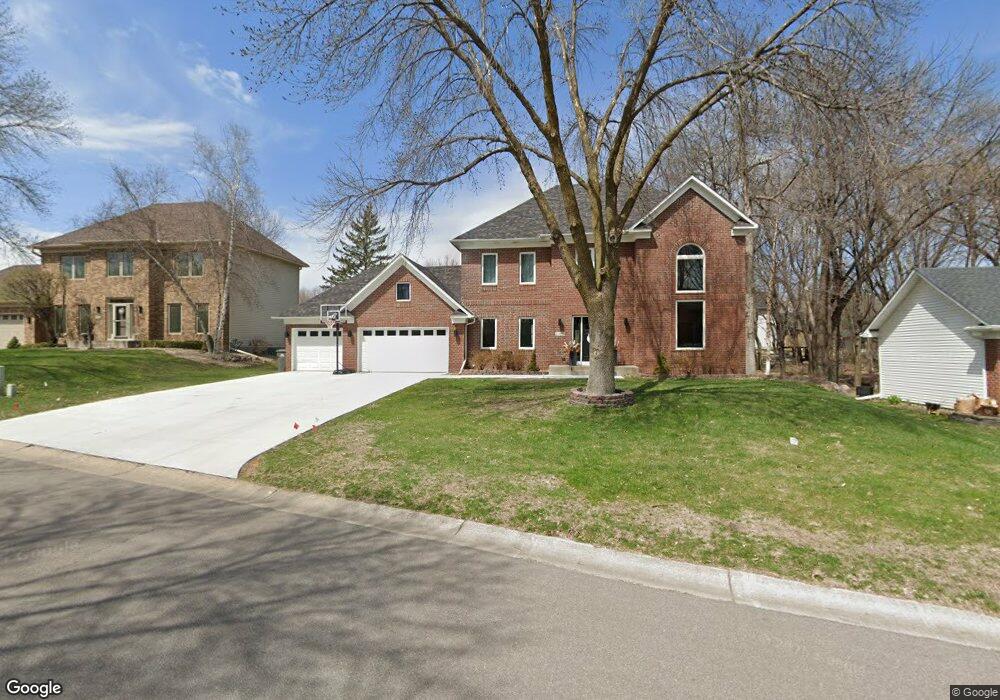
2186 Boulder Rd Chanhassen, MN 55317
Estimated Value: $610,000 - $677,000
3
Beds
3
Baths
2,540
Sq Ft
$254/Sq Ft
Est. Value
About This Home
This home is located at 2186 Boulder Rd, Chanhassen, MN 55317 and is currently estimated at $646,188, approximately $254 per square foot. 2186 Boulder Rd is a home located in Carver County with nearby schools including Bluff Creek Elementary, Chaska Middle School West, and Chanhassen High School.
Ownership History
Date
Name
Owned For
Owner Type
Purchase Details
Closed on
May 16, 2019
Sold by
Werner Kristina F and Werner Christopher E
Bought by
Schmidt Mark and Schmidt Sara B
Current Estimated Value
Home Financials for this Owner
Home Financials are based on the most recent Mortgage that was taken out on this home.
Original Mortgage
$397,100
Outstanding Balance
$348,422
Interest Rate
4.1%
Mortgage Type
New Conventional
Estimated Equity
$297,766
Purchase Details
Closed on
Aug 28, 2017
Sold by
Thomson Carolyn D and Thomson Thomas M
Bought by
Werner Kristina F
Home Financials for this Owner
Home Financials are based on the most recent Mortgage that was taken out on this home.
Original Mortgage
$361,000
Interest Rate
3.92%
Mortgage Type
New Conventional
Purchase Details
Closed on
Mar 30, 2001
Sold by
Stakas Kenneth A and Stakes Elena F
Bought by
Thomson Thomas M and Thomson Carolyn D
Create a Home Valuation Report for This Property
The Home Valuation Report is an in-depth analysis detailing your home's value as well as a comparison with similar homes in the area
Home Values in the Area
Average Home Value in this Area
Purchase History
| Date | Buyer | Sale Price | Title Company |
|---|---|---|---|
| Schmidt Mark | $418,000 | Trademark Title Services Inc | |
| Werner Kristina F | $380,000 | Dca Title | |
| Thomson Thomas M | $330,000 | -- |
Source: Public Records
Mortgage History
| Date | Status | Borrower | Loan Amount |
|---|---|---|---|
| Open | Schmidt Mark | $397,100 | |
| Previous Owner | Werner Kristina F | $361,000 |
Source: Public Records
Tax History
| Year | Tax Paid | Tax Assessment Tax Assessment Total Assessment is a certain percentage of the fair market value that is determined by local assessors to be the total taxable value of land and additions on the property. | Land | Improvement |
|---|---|---|---|---|
| 2025 | $6,664 | $599,500 | $160,000 | $439,500 |
| 2024 | $6,526 | $576,000 | $155,000 | $421,000 |
| 2023 | $6,088 | $566,800 | $155,000 | $411,800 |
| 2022 | $5,524 | $532,800 | $150,000 | $382,800 |
| 2021 | $5,178 | $455,200 | $119,500 | $335,700 |
| 2020 | $5,070 | $434,800 | $119,500 | $315,300 |
| 2019 | $5,378 | $440,900 | $113,800 | $327,100 |
| 2018 | $5,088 | $440,900 | $113,800 | $327,100 |
| 2017 | $4,816 | $405,800 | $106,400 | $299,400 |
| 2016 | $4,970 | $363,400 | $0 | $0 |
| 2015 | $4,970 | $366,400 | $0 | $0 |
| 2014 | $4,970 | $338,200 | $0 | $0 |
Source: Public Records
Map
Nearby Homes
- 2031 Timberwood Dr
- 2536 Bridle Creek Trail
- 2101 Timberwood Dr
- 7892 Autumn Ridge Ave
- 8682 Flamingo Dr
- 8800 Sunset Trail
- 2029 Poppy Dr
- 1460 Jersey Way
- 8581 Flamingo Dr
- 8561 Flamingo Dr
- 9085 Mills Dr
- 7702 Bluebonnet Blvd
- 9115 Mills Dr
- 9155 Mills Dr
- 1574 Lake Susan Hills Dr
- 7703 Vasserman Place
- 3 Birdie Ln
- 1968 Lincoln Ln
- 1331 Lake Dr W Unit A213
- 1570 Avienda Ln
- 2198 Boulder Rd
- 2174 Boulder Rd
- 2187 Boulder Rd
- 2175 Boulder Rd
- 2162 Boulder Rd
- 5201 Boulder Rd
- 2199 Boulder Rd
- 2208 Boulder Rd
- 2203 Stone Creek Dr
- 2193 Stone Creek Dr
- 2163 Boulder Rd
- 2181 Stone Creek Dr
- 2207 Boulder Rd
- 2150 Boulder Rd
- 2217 Stone Creek Dr
- 2220 Boulder Rd
- 2151 Boulder Rd
- 2169 Stone Creek Dr
- 2136 Boulder Rd
- 2219 Boulder Rd
Your Personal Tour Guide
Ask me questions while you tour the home.