
Landlord's Agent in 2015
Pam Getz
Drake Realty
(317) 446-3148
1 in this area
27 Total Sales

Estimated Value: $263,000 - $282,000
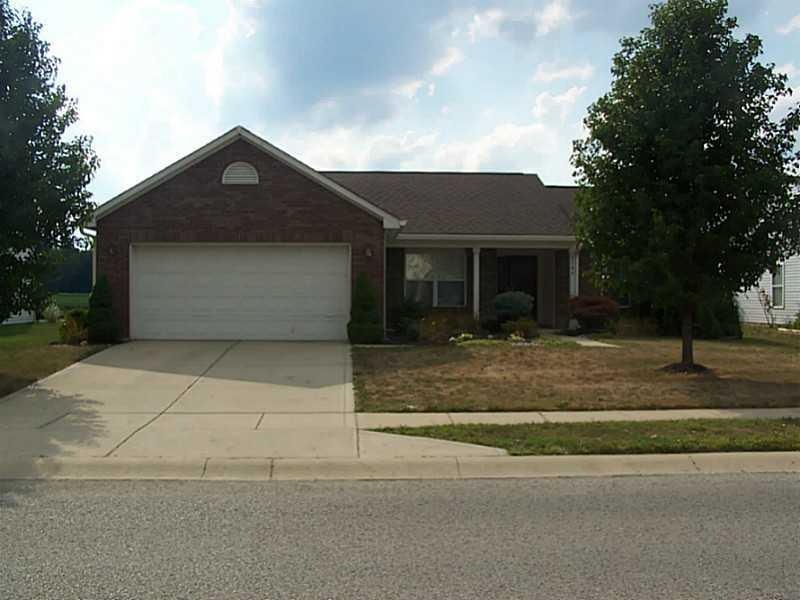
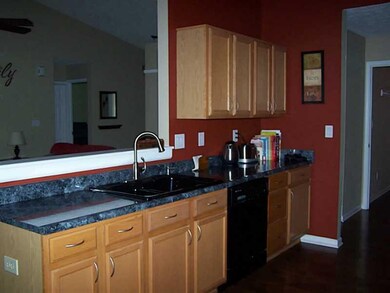
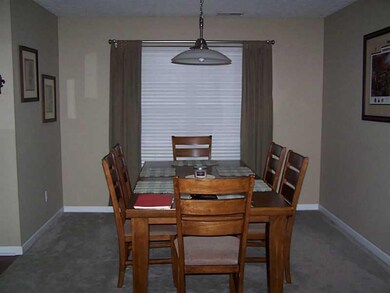
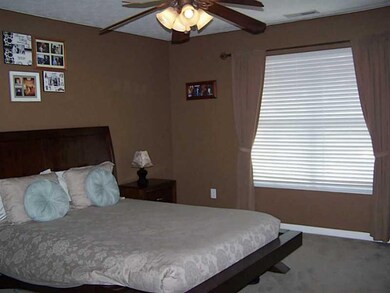
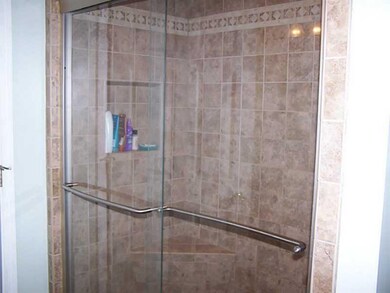
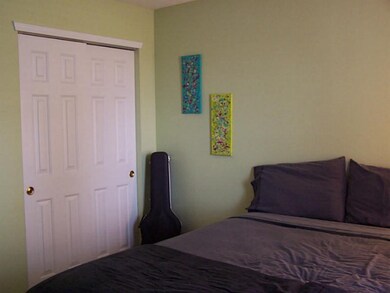
Absolutely beautiful 3 bedrooms, 2 baths. Spacious great room. Formal dining room with gourmet kitchen. All appliances. Fenced back yard. Move-in before Christmas
Co-Listed By
Jane Drake
Last Renter's Agent
Jane Drake
Drake Realty
| Date | Buyer | Sale Price | Title Company |
|---|---|---|---|
| Schenkel Tyler K | -- | Chicago Title Company Llc |
| Date | Status | Borrower | Loan Amount |
|---|---|---|---|
| Open | Schenkel Tyler K | $122,550 |
| Date | Event | Price | List to Sale | Price per Sq Ft | Prior Sale |
|---|---|---|---|---|---|
| 02/18/2015 02/18/15 | Rented | $1,200 | 0.0% | -- | |
| 02/16/2015 02/16/15 | Under Contract | -- | -- | -- | |
| 12/11/2014 12/11/14 | For Rent | $1,200 | 0.0% | -- | |
| 09/25/2013 09/25/13 | Rented | $1,200 | 0.0% | -- | |
| 09/04/2013 09/04/13 | Under Contract | -- | -- | -- | |
| 08/22/2013 08/22/13 | For Rent | $1,200 | 0.0% | -- | |
| 08/31/2012 08/31/12 | Sold | $120,000 | 0.0% | $74 / Sq Ft | View Prior Sale |
| 07/17/2012 07/17/12 | Pending | -- | -- | -- | |
| 06/05/2012 06/05/12 | For Sale | $120,000 | -- | $74 / Sq Ft |
| Year | Tax Paid | Tax Assessment Tax Assessment Total Assessment is a certain percentage of the fair market value that is determined by local assessors to be the total taxable value of land and additions on the property. | Land | Improvement |
|---|---|---|---|---|
| 2025 | $2,364 | $234,200 | $19,700 | $214,500 |
| 2024 | $2,364 | $214,300 | $20,100 | $194,200 |
| 2023 | $2,253 | $204,200 | $20,100 | $184,100 |
| 2022 | $2,198 | $197,700 | $20,100 | $177,600 |
| 2021 | $1,762 | $159,700 | $13,100 | $146,600 |
| 2020 | $1,591 | $144,900 | $13,100 | $131,800 |
| 2019 | $1,505 | $137,400 | $11,500 | $125,900 |
| 2018 | $1,278 | $131,500 | $11,500 | $120,000 |
| 2017 | $1,240 | $124,000 | $11,500 | $112,500 |
| 2016 | $1,174 | $119,000 | $11,500 | $107,500 |
| 2014 | $1,153 | $114,300 | $21,400 | $92,900 |
| 2013 | $1,153 | $115,300 | $21,400 | $93,900 |
Landlord's Agent in 2015
Pam Getz
Drake Realty
(317) 446-3148
1 in this area
27 Total Sales
J
Landlord's Co-Listing Agent in 2015
Jane Drake
J
Buyer's Agent in 2013
Julianne Hurdle
F.C. Tucker Company
M
Seller's Agent in 2012
Mike Watkins
Dropped Members
Source: MIBOR Broker Listing Cooperative®
MLS Number: MBR21328104
APN: 41-08-10-024-149.000-009
Disclaimer: Certain information contained herein is derived from information provided by parties other than Homes.com. All information provided is deemed reliable, but is not guaranteed to be accurate and should be independently verified.
![]() Based on information submitted to the MLS GRID. All data is obtained from various sources and may not have been verified by broker or MLS GRID. Supplied Open House Information is subject to change without notice. All information should be independently reviewed and verified for accuracy. Properties may or may not be listed by the office/agent presenting the information. Some IDX listings have been excluded from this website.
Based on information submitted to the MLS GRID. All data is obtained from various sources and may not have been verified by broker or MLS GRID. Supplied Open House Information is subject to change without notice. All information should be independently reviewed and verified for accuracy. Properties may or may not be listed by the office/agent presenting the information. Some IDX listings have been excluded from this website.